


BRUSSELS--(BUSINESS WIRE)--Anheuser-Busch InBev (Brussel:ABI) (BMV:ANB) (JSE:ANH) (NYSE:BUD):
Regulated information1
“Beer is a passion point for consumers. The strength of the beer category and the continued momentum of our megabrands delivered another quarter of profitable growth. EBITDA increased at the top-end of our outlook and the ongoing optimization of our business drove Underlying EPS growth of 7.1%. The consistent execution of our strategy by our teams and partners drove a solid start to the year and reinforces our confidence in delivering on our outlook for 2025.” – Michel Doukeris, CEO, AB InBev
|
Revenue +1.5% Revenue increased by 1.5% with revenue per hl growth of 3.7%. Reported revenue decreased by 6.3% to 13 628 million USD, impacted by unfavorable currency translation.
4.4% increase in combined revenues of our megabrands, led by Corona, which grew by 11.2% outside of its home market in 1Q25.
34% increase in revenue of our no-alcohol beer portfolio.
53% increase in Gross Merchandise Value (GMV) from sales of third-party products through BEES Marketplace to reach 645 million USD.
Volumes -2.2% Volumes declined by 2.2%, with beer volumes down by 2.5% and non-beer volumes down by 0.2%. |
Normalized EBITDA +7.9% In 1Q25, Normalized EBITDA increased by 7.9% to 4 855 million USD with a margin expansion of 218bps to 35.6%.
Underlying Profit 1 606 million USD Underlying Profit was 1 606 million USD in 1Q25 compared to 1 509 million USD in 1Q24. Reported profit attributable to equity holders of AB InBev was 2 148 million USD in 1Q25 compared to 1 091 million USD in 1Q24, positively impacted by non-underlying items.
Underlying EPS 0.81 USD Underlying EPS increased by 7.1% to 0.81 USD. On a constant currency basis, Underlying EPS increased by 20.2%. |
|
1The enclosed information constitutes regulated information as defined in the Belgian Royal Decree of 14 November 2007 regarding the duties of issuers of financial instruments which have been admitted for trading on a regulated market. For important disclaimers and notes on the basis of preparation, please refer to page 12. |
Management comments
Solid start to the year with EBITDA growth at the top-end of our outlook, continued margin expansion and high-single digit Underlying EPS growth
Our business delivered another quarter of solid financial performance in 1Q25. EBITDA increased by 7.9% with margin expansion of 218bps driven by top-line growth, cost of sales tailwinds and disciplined overhead management. Underlying EPS was 0.81 USD, a 7.1% increase in USD and a 20.2% increase in constant currency versus 1Q24, driven by 10.3% EBIT growth and the continued optimization of our net finance costs.
Top-line increased by 1.5%, with revenue growth in approximately 50% of our markets, driven by a revenue per hl increase of 3.7% as a result of disciplined revenue management choices and ongoing premiumization. We increased our overall portfolio brand power driven by increased marketing investment and effectiveness. In addition, we estimate that we gained or maintained market share in 60% of our markets. Volume performance was, however, impacted by calendar-related factors such as cycling the leap year selling-day benefit in 1Q24 and Easter shipment phasing, resulting in a decline of 2.2%.
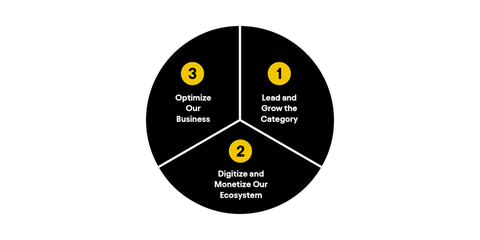
Progressing our strategic priorities
We continue to execute on and invest in three key strategic pillars to deliver consistent growth and long-term value creation.
(1) Lead and grow the category:
We increased our overall portfolio brand power driven by increased marketing investment and effectiveness. In addition, we estimate that we gained or maintained market share in 60% of our markets.
(2) Digitize and monetize our ecosystem:
BEES Marketplace captured 645 million USD in GMV from sales of third-party products, a 53% increase versus 1Q24. Overall BEES GMV increased by 10%, reaching 11.6 billion USD.
(3) Optimize our business:
Underlying EPS was 0.81 USD, a 7.1% increase in USD and a 20.2% increase in constant currency terms versus 1Q24, driven by 10.3% EBIT growth and the continued optimization of our net finance costs.
(1) Lead and grow the category
We are executing on our five replicable levers to drive category growth. Our performance across each of the levers was led by our megabrands which delivered a 4.4% revenue increase.
- Category Participation: Investments in our megabrands and innovations drove an estimated increase of 60 basis points in the percentage of legal drinking age consumers purchasing our portfolio across our key markets, the equivalent of 6 million new consumers on an annualized basis. Participation increases were driven by our megabrands and no-alcohol beer portfolio.
- Core Superiority: Revenue of our mainstream portfolio increased by 0.3%, driven by double-digit growth in South Korea and mid-single digit growth in Colombia and Mexico.
- Balanced Choices: Our balanced choices portfolio of low carb, sugar free, gluten free and no- and low-alcohol beer brands delivered a revenue increase of 2.7%. Growth was led by our no-alcohol beer portfolio which delivered a 34% revenue increase and is estimated to have gained share of no-alcohol beer across our footprint, led by Corona Cero which grew volume by triple-digits.
- Premiumization: Our above core beer portfolio delivered a 1.8% revenue increase. Corona led our performance, increasing revenue by 11.2% outside of Mexico with double-digit volume growth in more than 30 markets.
- Beyond Beer: Growth of our Beyond Beer portfolio accelerated in 1Q25, increasing revenue by 16.6%, led by double-digit growth of Cutwater and Nütrl in the US and Beats in Brazil.
(2) Digitize and monetize our ecosystem
- Digitizing our relationships with more than 6 million customers globally: As of 31 March 2025, BEES was live in 28 markets with 72% of our revenues captured through B2B digital platforms. In 1Q25, BEES captured 11.6 billion USD in GMV, growth of 10% versus 1Q24.
- Monetizing our route-to-market: BEES Marketplace generated 10 million orders and captured 645 million USD in GMV from sales of third-party products, growth of 27% and 53% versus 1Q24, respectively.
- Leading the way in DTC solutions: Our omnichannel DTC ecosystem of digital and physical products generated revenue of approximately 275 million USD. Our DTC megabrands, Zé Delivery, TaDa Delivery and PerfectDraft, generated 19.2 million e-commerce orders and delivered 117 million USD in revenue this quarter, representing 12% growth versus 1Q24.
(3) Optimize our business
- Maximizing value creation: EBITDA grew by 7.9% with margin expansion of 218bps supported by disciplined resource allocation and overhead management. Optimization of our net capex drove increased efficiency in depreciation and amortization expenses, resulting in 10.3% EBIT growth. As of 5 May 2025, we have completed 70% of our 2 billion USD share buyback program announced on 31 October 2024.
- Advancing our sustainability priorities: In Climate Action, our Scopes 1 and 2 emissions per hectoliter of production was 4.44 kgCO2e/hl in 1Q25, a reduction of 45.7% against the 2017 baseline. In Water Stewardship, our water use efficiency ratio improved to 2.44 hl per hl in 1Q25 versus 2.55 hl per hl in 1Q24, as we continue working towards our ambition to reach 2.50 hl per hl on an annual basis by the end of 2025.
Delivering reliable compounding growth
We are encouraged by our results to start the year, the resilience of the beer category and the consistent execution of our strategy by our teams and partners. Our business is local, with more than 98% of our volume locally produced, and our footprint has structural tailwinds for long-term volume growth with favorable demographics, ongoing economic development and opportunities to increase category participation. Our consistent performance and the fundamental strengths of our business reinforce our confidence in our ability to deliver reliable compounding growth and create a future with more cheers.
2025 Outlook
(i) Overall Performance: We expect our EBITDA to grow in line with our medium-term outlook of between 4-8%. The outlook for FY25 reflects our current assessment of inflation and other macroeconomic conditions.
(ii) Net Finance Costs: Net pension interest expenses and accretion expenses are expected to be in the range of 190 to 220 million USD per quarter, depending on currency and interest rate fluctuations. We expect the average gross debt coupon in FY25 to be approximately 4%.
(iii) Effective Tax Rate (ETR): We expect the normalized ETR in FY25 to be in the range of 26% to 28%. The ETR outlook does not consider the impact of potential future changes in legislation.
(iv) Net Capital Expenditure: We expect net capital expenditure of between 3.5 and 4.0 billion USD in FY25.
|
Figure 1. Consolidated performance |
|||||||
|
in USD Mio, except EPS in USD per share and Volumes in thousand hls |
1Q24 |
1Q25 |
Organic |
||||
|
growth |
|||||||
|
Volumes |
139 536 |
136 268 |
(2.2 |
)% |
|||
|
Beer |
119 683 |
116 778 |
(2.5 |
)% |
|||
|
Non-Beer |
19 852 |
19 490 |
(0.2 |
)% |
|||
|
Revenue |
14 547 |
13 628 |
1.5 |
% |
|||
|
Gross profit |
7 894 |
7 583 |
5.2 |
% |
|||
|
Gross margin |
54.3% |
55.6% |
203bps |
||||
|
Normalized EBITDA |
4 987 |
4 855 |
7.9 |
% |
|||
|
Normalized EBITDA margin |
34.3% |
35.6% |
218bps |
||||
|
Normalized EBIT |
3 642 |
3 587 |
10.3 |
% |
|||
|
Normalized EBIT margin |
25.0% |
26.3% |
218bps |
||||
|
|
|||||||
|
Profit attributable to equity holders of AB InBev |
1 091 |
2 148 |
|||||
|
Underlying Profit |
1 509 |
1 606 |
|||||
|
|
|||||||
|
Basic EPS |
0.54 |
1.08 |
|||||
|
Underlying EPS |
0.75 |
0.81 |
|
||||
|
Figure 2. Volumes |
||||||||||||||||
|
in thousand hls |
1Q24 |
Scope |
Organic growth |
1Q25 |
Organic growth |
|||||||||||
|
Total |
Beer |
|||||||||||||||
|
North America |
21 353 |
(144 |
) |
(1 368 |
) |
19 842 |
(6.4 |
)% |
(6.4 |
)% |
||||||
|
Middle Americas |
35 690 |
- |
|
(610 |
) |
35 081 |
(1.7 |
)% |
(1.5 |
)% |
||||||
|
South America |
40 347 |
- |
|
544 |
|
40 891 |
1.3 |
% |
1.4 |
% |
||||||
|
EMEA |
21 030 |
(35 |
) |
(243 |
) |
20 752 |
(1.2 |
)% |
(1.8 |
)% |
||||||
|
Asia Pacific |
21 045 |
(93 |
) |
(1 304 |
) |
19 648 |
(6.2 |
)% |
(6.2 |
)% |
||||||
|
Global Export and Holding Companies |
70 |
(3 |
) |
(13 |
) |
54 |
(19.2 |
)% |
(19.2 |
)% |
||||||
|
AB InBev Worldwide |
139 536 |
(274 |
) |
(2 993 |
) |
136 268 |
(2.2 |
)% |
(2.5 |
)% |
||||||
Key Markets Performance
United States: Michelob Ultra growth drove continued market share gain
- Operating performance: Revenue declined by 5.1% with revenue per hl increasing by 1.7% driven by revenue management initiatives and premiumization. Sales-to-retailers decreased by 5.4%, estimated to have outperformed the industry which was negatively impacted by adverse weather and Easter shipment phasing. Sales-to-wholesalers (STWs) declined by 6.7%, impacted by one less selling day versus 1Q24. EBITDA declined by 1.7% as top-line performance was partially offset by productivity initiatives and SG&A efficiencies while we continued to increase marketing investments.
- Commercial highlights: Our portfolio is estimated to have gained market share of the beer industry and the spirits-based ready-to-drink (RTD) category, according to Circana. Our beer portfolio was led by Michelob Ultra and Busch Light, which were the #1 and #2 volume share gainers in the industry respectively, while our RTD portfolio delivered strong double-digit volume growth, led by Cutwater and Nütrl. We are the leader in no-alcohol beer, with our portfolio growing volumes in the high-twenties, driven by Michelob Ultra Zero which was the #1 innovation in the beer industry in 1Q25. The beer category in 1Q25 was impacted by adverse weather and calendar-related factors but trends have improved in April, according to Circana, as weather patterns normalized.
Mexico: Revenue growth and margin expansion drove double-digit bottom-line growth
- Operating performance: Revenue increased by mid-single digits, with mid-single digit revenue per hl growth driven by revenue management initiatives. Volumes declined by low-single digits, in-line with the industry, which was negatively impacted by calendar-related factors. EBITDA grew by mid-teens with margin expansion.
- Commercial highlights: Our performance was led by our above core beer portfolio, which grew revenue by high-single digits driven by Modelo, while our core beer brands delivered mid-single digit revenue growth. We are leading the growth in no-alcohol beer with Corona Cero growing volume by strong double-digits. We continued to progress our digital initiatives, with BEES Marketplace growing GMV by 42% versus 1Q24 and our digital DTC platform, TaDa Delivery, increasing the number of orders by 18%.
Colombia: Record high volumes drove double-digit bottom-line growth
- Operating performance: Revenue increased by high-single digits with mid-single digit revenue per hl growth, driven by revenue management initiatives. Volumes grew by low-single digits, with our portfolio maintaining share of total alcohol. EBITDA grew by low-teens with margin expansion.
- Commercial highlights: Our above core beer brands led our performance, delivering high-single digit volume growth and driving record high first quarter volumes. Our core beer portfolio delivered a low-single digit volume increase driven by the continued growth of Aguila.
Brazil: Continued momentum drove double-digit bottom-line growth with margin expansion and all-time high volumes
- Operating performance: Revenue grew by 4.6% with revenue per hl growth of 3.1% driven by premiumization and revenue management initiatives. Total volumes grew by 1.4%, with beer volume increasing by 0.8%. Non-beer volumes grew by 3.2%. EBITDA increased by 13.5% with margin expansion of 278bps.
- Commercial highlights: Our premium and super premium beer brands led our performance, delivering low-twenties volume growth, driven by Stella Artois and Corona. We are the leader in no-alcohol beer, with our volumes growing by strong double-digits, led by Brahma 0.0 and Corona Cero. Non-beer performance was driven by our low- and no-sugar portfolio, which grew volumes in the low-twenties. We continued to progress our digital initiatives, with BEES Marketplace growing GMV by 92%, and our digital DTC platform, Zé Delivery, generating nearly 17 million orders this quarter, a 5% increase versus 1Q24.
Europe: Continued premiumization and margin recovery drove double-digit bottom-line growth
- Operating performance: Revenue declined by low-single digits with low-single digit revenue per hl growth driven by continued premiumization. Volumes declined by low-single digits, estimated to be in-line with or outperforming the industry in the majority of our key markets, which was negatively impacted by calendar-related factors. EBITDA grew by low-teens with margin recovery.
- Commercial highlights: We continued to premiumize our portfolio, with our premium and super premium portfolio making up 60% of our 1Q25 revenue. Our performance was driven by our megabrands, with Corona and Stella Artois growing volumes by low-single digits. Our no-alcohol beer portfolio grew volumes by high-teens, led by Corona Cero which delivered strong double-digit volume growth. In the UK, as of January 2025, we have strengthened our portfolio with the addition of the San Miguel brand and are now the leading brewer in the industry.
South Africa: Continued momentum and market share gain delivered another quarter of top- and bottom-line growth
- Operating performance: Revenue increased by low-single digits with revenue per hl growth of low-single digits. Volumes declined by low-single digits, estimated to have outperformed the industry which was negatively impacted by calendar-related factors. EBITDA grew by low-single digits.
- Commercial highlights: The momentum of our business continued, with the consistent execution of our strategy driving estimated market share gains in both beer and Beyond Beer. Our performance was led by our premium and super premium brands, which grew volumes by low-teens driven by Corona and Stella Artois. In Beyond Beer, our portfolio grew volumes by mid-single digits.
China: Performance impacted by soft industry in our footprint
- Operating performance: Volumes declined by 9.2%, underperforming the industry according to our estimates, with our performance impacted by continued industry weakness in our key regions and the on-premise channel, and inventory management, which accounted for approximately one quarter of our volume decline. Revenue per hl decreased by 3.9%, driven by negative geographic and channel mix, resulting in a revenue decline of 12.7%. EBITDA declined by 15.2%.
- Commercial highlights: We remain confident in our strategy, centered on premiumization, channel and geographic expansion, and digital transformation. We are strengthening our execution, increasing investments in our megabrands and accelerating our in-home channel expansion. In 1Q25, our marketing campaigns included extensive Chinese New Year activations and updated brand imagery for Budweiser, and a new integrated campaign for Harbin Zero Sugar with the NBA. The usage and reach of the BEES platform continued to expand and, as of March 2025, is present in more than 320 cities.
Highlights from our other markets
- Canada: Revenue declined by low-single digits with low-single digit revenue per hl growth. Volumes declined by mid-single digits, outperforming a soft industry according to our estimates, which was negatively impacted by adverse weather and calendar-related factors. Michelob Ultra and Busch continued to outperform and were the #1 and #2 volume share gainers in the industry.
- Peru: Revenue grew by low-single digits, with mid-single digit revenue per hl growth driven by revenue management initiatives. Volumes declined by low-single digits, estimated to be in-line with the industry, which was negatively impacted by calendar-related factors.
- Ecuador: Revenue declined by mid-single digits with volumes declining by mid-single digits as the industry was impacted by calendar-related factors, three fewer trading days due to election related dry laws, and cycled a strong performance in 1Q24 which benefitted from shipment phasing ahead of a sales tax increase.
- Argentina: Volume trends improved sequentially, declining by mid-single digits, with beer volumes estimated to be in-line with the industry, as overall consumer demand continued to be impacted by inflationary pressures. Since 1Q24, the definition of organic revenue growth in Argentina has been amended to cap the price growth to a maximum of 2% per month. Revenue grew by low-twenties on this basis.
-
Africa excluding South Africa: In Nigeria, revenue grew by strong double-digits, driven by revenue management initiatives in a highly inflationary environment. Beer volumes declined by mid-single digits as our performance was impacted by production constraints.
In our other markets in Africa, we grew volume in aggregate by mid-single digits, driven by Mozambique and Tanzania. - South Korea: Revenue increased by low-teens with flattish revenue per hl. Volumes grew by low-teens, estimated to have outperformed the industry in both the on-trade and in-home channels. Our performance was led by our core portfolio and innovations, with volumes supported by shipment phasing ahead of an announced April price increase.
Consolidated Income Statement
|
Figure 3. Consolidated income statement |
|||||||||
|
in USD Mio |
1Q24 |
1Q25 |
Organic |
||||||
|
growth |
|||||||||
|
Revenue |
14 547 |
|
13 628 |
|
1.5 |
% |
|||
|
Cost of sales |
(6 653 |
) |
(6 044 |
) |
3.1 |
% |
|||
|
Gross profit |
7 894 |
|
7 583 |
|
5.2 |
% |
|||
|
SG&A |
(4 435 |
) |
(4 188 |
) |
(1.3 |
)% |
|||
|
Other operating income/(expenses) |
183 |
|
192 |
|
9.1 |
% |
|||
|
Normalized EBIT |
3 642 |
|
3 587 |
|
10.3 |
% |
|||
|
Non-underlying items above EBIT |
(29 |
) |
(49 |
) |
|||||
|
Net finance income/(cost) |
(1 187 |
) |
(984 |
) |
|||||
|
Non-underlying net finance income/(cost) |
(309 |
) |
602 |
|
|||||
|
Share of results of associates |
57 |
|
52 |
|
|||||
|
Non-underlying share of results of associates |
104 |
|
- |
|
|||||
|
Income tax expense |
(794 |
) |
(664 |
) |
|||||
|
Profit |
1 485 |
|
2 544 |
|
|||||
|
Profit attributable to non-controlling interest |
393 |
|
396 |
|
|||||
|
Profit attributable to equity holders of AB InBev |
1 091 |
|
2 148 |
|
|||||
|
Normalized EBITDA |
4 987 |
|
4 855 |
|
7.9 |
% |
|||
|
Underlying Profit |
1 509 |
|
1 606 |
|
|
||||
Non-underlying items above EBIT & Non-underlying share of results of associates
|
Figure 4. Non-underlying items above EBIT & Non-underlying share of results of associates |
||||||
|
in USD Mio |
1Q24 |
1Q25 |
||||
|
Restructuring |
(31 |
) |
(12 |
) |
||
|
Business and asset disposal (incl. impairment losses) |
2 |
|
(37 |
) |
||
|
Non-underlying items in EBIT |
(29 |
) |
(49 |
) |
||
|
Non-underlying share of results of associates |
104 |
|
- |
|
||
Normalized EBIT excludes negative non-underlying items of 49 million USD in 1Q25 and 29 million USD in 1Q24. Non-underlying share of results from associates of 1Q24 included the impact from our associate Anadolu Efes’ adoption of IAS 29 hyperinflation accounting on their 2023 results.
Net finance income/(cost)
|
Figure 5. Net finance income/(cost) |
||||||
|
in USD Mio |
1Q24 |
1Q25 |
||||
|
Net interest expense |
(714 |
) |
(651 |
) |
||
|
Net interest on net defined benefit liabilities |
(22 |
) |
(18 |
) |
||
|
Accretion expense |
(191 |
) |
(149 |
) |
||
|
Net interest income on Brazilian tax credits |
36 |
|
30 |
|
||
|
Other financial results |
(296 |
) |
(196 |
) |
||
|
Net finance income/(cost) |
(1 187 |
) |
(984 |
) |
||
Non-underlying net finance income/(cost)
|
Figure 6. Non-underlying net finance income/(cost) |
|||||
|
in USD Mio |
1Q24 |
1Q25 |
|||
|
Mark-to-market |
(243 |
) |
602 |
||
|
Gain/(loss) on bond redemption and other |
(66 |
) |
- |
||
|
Non-underlying net finance income/(cost) |
(309 |
) |
602 |
||
Non-underlying net finance cost in 1Q25 includes mark-to-market gains on derivative instruments entered into in order to hedge our share-based payment programs and shares issued in relation to the combination with Grupo Modelo and SAB.
The number of shares covered by the hedging of our share-based payment program, the deferred share instrument and the restricted shares are shown below, together with the opening and closing share prices.
|
Figure 7. Non-underlying equity derivative instruments |
||||
|
1Q24 |
1Q25 |
|||
|
Share price at the start of the period (Euro) |
58.42 |
48.25 |
||
|
Share price at the end of the period (Euro) |
56.46 |
56.92 |
||
|
Number of equity derivative instruments at the end of the period (millions) |
100.5 |
100.5 |
Income tax expense
|
Figure 8. Income tax expense |
||||
|
in USD Mio |
1Q24 |
1Q25 |
||
|
Income tax expense |
794 |
664 |
||
|
Effective tax rate |
37.5% |
21.0% |
||
|
Normalized effective tax rate |
27.0% |
25.9% |
The 1Q25 effective tax rate was positively impacted by non-taxable gains from derivatives related to the hedging of share-based payment programs and of the shares issued in a transaction related to the combination with Grupo Modelo and SAB, while the 1Q24 effective tax rate was negatively impacted by non-deductible losses from these derivatives.
Furthermore, the 1Q24 effective tax rate includes 240 million USD (4.5 billion ZAR) non-underlying tax cost following the resolution in 1Q24 of the South African tax matters described in note 29 Contingencies of the 2024 Consolidated Financial Statements.
The decrease in Normalized ETR in 1Q25 compared to 1Q24 is driven mainly by country mix.
Underlying EPS
|
Figure 9. Underlying EPS |
||||||
|
in USD per share, except number of shares in million |
1Q24 |
1Q25 |
||||
|
Normalized EBITDA |
2.48 |
|
2.43 |
|
||
|
Depreciation, amortization and impairment |
(0.67 |
) |
(0.64 |
) |
||
|
Normalized EBIT |
1.81 |
|
1.80 |
|
||
|
Net finance income/(cost) |
(0.59 |
) |
(0.49 |
) |
||
|
Income tax expense |
(0.33 |
) |
(0.34 |
) |
||
|
Associates & non-controlling interests |
(0.17 |
) |
(0.17 |
) |
||
|
Hyperinflation impacts |
0.03 |
|
0.01 |
|
||
|
Underlying EPS |
0.75 |
|
0.81 |
|
||
|
Weighted average number of ordinary and restricted shares |
2 007 |
|
1 994 |
|
||
Reconciliation of IFRS and Non-IFRS Financial Measures
Profit attributable to equity holders and Underlying Profit
|
Figure 10. Underlying Profit |
|||||
|
in USD Mio |
1Q24 |
1Q25 |
|||
|
Profit attributable to equity holders of AB InBev |
1 091 |
2 148 |
|
||
|
Net impact of non-underlying items on profit |
362 |
(565 |
) |
||
|
Hyperinflation impacts |
55 |
23 |
|
||
|
Underlying Profit |
1 509 |
1 606 |
|
||
Basic and Underlying EPS
|
Figure 11. Basic and Underlying EPS |
|||||
|
in USD per share, except number of shares in million |
1Q24 |
1Q25 |
|||
|
Basic EPS |
0.54 |
1.08 |
|
||
|
Net impact of non-underlying items |
0.18 |
(0.28 |
) |
||
|
Hyperinflation impacts |
0.03 |
0.01 |
|
||
|
Underlying EPS |
0.75 |
0.81 |
|
||
|
FX translation impact |
- |
0.09 |
|
||
|
Underlying EPS in constant currency |
0.75 |
0.90 |
|
||
|
Weighted average number of ordinary and restricted shares |
2 007 |
1 994 |
|
||
Profit attributable to equity holders and Normalized EBITDA
|
Figure 12. Reconciliation of Normalized EBITDA to Profit attributable to equity holders of AB InBev |
||||||
|
in USD Mio |
1Q24 |
1Q25 |
||||
|
Profit attributable to equity holders of AB InBev |
1 091 |
|
2 148 |
|
||
|
Non-controlling interests |
393 |
|
396 |
|
||
|
Profit |
1 485 |
|
2 544 |
|
||
|
Income tax expense |
794 |
|
664 |
|
||
|
Share of result of associates |
(57 |
) |
(52 |
) |
||
|
Non-underlying share of results of associates |
(104 |
) |
- |
|
||
|
Net finance (income)/cost |
1 187 |
|
984 |
|
||
|
Non-underlying net finance (income)/cost |
309 |
|
(602 |
) |
||
|
Non-underlying items above EBIT (incl. impairment losses) |
29 |
|
49 |
|
||
|
Normalized EBIT |
3 642 |
|
3 587 |
|
||
|
Depreciation, amortization and impairment |
1 344 |
|
1 268 |
|
||
|
Normalized EBITDA |
4 987 |
|
4 855 |
|
||
Normalized EBITDA, Normalized EBIT and Underlying Profit are non-IFRS financial measures used by AB InBev to reflect the company’s underlying performance. Underlying EPS and constant currency Underlying EPS are non-IFRS financial measures that AB InBev believes are useful to investors because they facilitate comparisons of EPS from period to period.
Normalized EBITDA is calculated by adjusting profit attributable to equity holders of AB InBev to exclude: (i) non-controlling interest; (ii) income tax expense; (iii) share of results of associates; (iv) non-underlying share of results of associates; (v) net finance income or cost; (vi) non-underlying net finance income or cost; (vii) non-underlying items above EBIT; and (viii) depreciation, amortization and impairment.
Underlying Profit is calculated by adjusting profit attributable to equity holders of AB InBev to exclude: (i) non-underlying items and (ii) hyperinflation impacts. Underlying EPS is calculated as Underlying Profit divided by the weighted average number of ordinary and restricted shares. Constant currency Underlying EPS is calculated as Underlying EPS excluding the effects of foreign currency translation by translating current period figures using the exchange rates from the same period in the prior year.
Normalized EBITDA, Normalized EBIT and Underlying Profit are not accounting measures under IFRS and should not be considered as an alternative to profit attributable to equity holders as a measure of operational performance, or an alternative to cash flow as a measure of liquidity. Underlying EPS and constant currency Underlying EPS are not accounting measures under IFRS and should not be considered as alternatives to earnings per share as a measure of operating performance on a per share basis. These non-IFRS financial measures do not have a standard calculation method and AB InBev’s definition of Normalized EBITDA, Normalized EBIT, Underlying Profit, Underlying EPS and constant currency Underlying EPS may not be comparable to that of other companies.
Notes
To facilitate the understanding of AB InBev’s underlying performance, the analyses of growth, including all comments in this press release, unless otherwise indicated, are based on organic growth and normalized numbers. In other words, financials are analyzed eliminating the impact of changes in currencies on translation of foreign operations, and scope changes. Since 1Q24, the definition of organic revenue growth has been amended to cap the price growth in Argentina to a maximum of 2% per month (26.8% year-over-year). Corresponding adjustments are made to all income statement related items in the organic growth calculations through scope changes. Scope changes also represent the impact of acquisitions and divestitures, the start or termination of activities or the transfer of activities between segments, curtailment gains and losses and year over year changes in accounting estimates and other assumptions that management does not consider as part of the underlying performance of the business. The organic growth of our global brands, Budweiser, Stella Artois, and Corona excludes exports to Australia for which a perpetual license was granted to a third party upon disposal of the Australia operations in 2020. All references per hectoliter (per hl) exclude US non-beverage activities. Whenever presented in this document, all performance measures (EBITDA, EBIT, profit, tax rate, EPS) are presented on a “normalized” basis, which means they are presented before non-underlying items. Non-underlying items are either income or expenses which do not occur regularly as part of the normal activities of the Company. They are presented separately because they are important for the understanding of the underlying sustainable performance of the Company due to their size or nature. Normalized measures are additional measures used by management and should not replace the measures determined in accordance with IFRS as an indicator of the Company’s performance. We are reporting the results from Argentina applying hyperinflation accounting since 3Q18. The IFRS rules (IAS 29) require us to restate the year-to-date results for the change in the general purchasing power of the local currency, using official indices before converting the local amounts at the closing rate of the period. In 1Q25, we reported a negative impact from hyperinflation accounting on the profit attributable to equity holders of AB InBev of (23) million USD. The impact in 1Q25 Basic EPS was (0.01) USD. Values in the figures and annexes may not add up, due to rounding. 1Q25 EPS is based upon a weighted average of 1 994 million shares compared to a weighted average of 2 007 million shares for 1Q24.
Legal disclaimer
This release contains “forward-looking statements”. These statements are based on the current expectations and views of future events and developments of the management of AB InBev and are naturally subject to uncertainty and changes in circumstances. The forward-looking statements contained in this release include statements other than historical facts and include statements typically containing words such as “will”, “may”, “should”, “believe”, “intends”, “expects”, “anticipates”, “targets”, “ambition”, “estimates”, “likely”, “foresees” and words of similar import. All statements other than statements of historical facts are forward-looking statements. You should not place undue reliance on these forward-looking statements, which reflect the current views of the management of AB InBev, are subject to numerous risks and uncertainties about AB InBev and are dependent on many factors, some of which are outside of AB InBev’s control. There are important factors, risks and uncertainties that could cause actual outcomes and results to be materially different, including, but not limited to the risks and uncertainties relating to AB InBev that are described under Item 3.D of AB InBev’s Annual Report on Form 20-F filed with the SEC on 12 March 2025. Many of these risks and uncertainties are, and will be, exacerbated by any further worsening of the global business and economic environment, including as a result of foreign currency exchange rate fluctuations and ongoing geopolitical conflicts. Other unknown or unpredictable factors could cause actual results to differ materially from those in the forward-looking statements. The forward-looking statements should be read in conjunction with the other cautionary statements that are included elsewhere, including AB InBev’s most recent Form 20-F and other reports furnished on Form 6-K, and any other documents that AB InBev has made public. Any forward-looking statements made in this communication are qualified in their entirety by these cautionary statements and there can be no assurance that the actual results or developments anticipated by AB InBev will be realized or, even if substantially realized, that they will have the expected consequences to, or effects on, AB InBev or its business or operations. Except as required by law, AB InBev undertakes no obligation to publicly update or revise any forward-looking statements, whether as a result of new information, future events or otherwise. The first quarter 2025 (1Q25) financial data set out in Figure 1 (except for the volume information), Figures 3 to 6, 8, 11 and 12 of this press release have been extracted from the group’s unaudited condensed consolidated interim financial statements as of and for the three months ended 31 March 2025, which have been reviewed by our statutory auditors PwC Réviseurs d’Entreprises SRL / PwC Bedrijfsrevisoren BV in accordance with the standards of the Public Company Accounting Oversight Board (United States). Financial data included in Figures 7, 9 and 11 have been extracted from the underlying accounting records as of and for the three months ended 31 March 2025. References in this document to materials on our websites, such as www.ab-inbev.com, are included as an aid to their location and are not incorporated by reference into this document.
Conference call and webcast
Investor Conference call and webcast on Thursday, 8 May 2025:
3.00pm Brussels / 2.00pm London / 9.00am New York
Registration details:
Webcast (listen-only mode):
AB InBev 1Q25 Results Webcast
To join by phone, please use one of the following two phone numbers:
Toll-Free: +1-877-407-8029
Toll: +1-201-689-8029
About AB InBev
Anheuser-Busch InBev (AB InBev) is a publicly traded company (Euronext: ABI) based in Leuven, Belgium, with secondary listings on the Mexico (MEXBOL: ANB) and South Africa (JSE: ANH) stock exchanges and with American Depositary Receipts on the New York Stock Exchange (NYSE: BUD). As a company, we dream big to create a future with more cheers. We are always looking to serve up new ways to meet life’s moments, move our industry forward and make a meaningful impact in the world. We are committed to building great brands that stand the test of time and to brewing the best beers using the finest ingredients. Our diverse portfolio of well over 500 beer brands includes global brands Budweiser®, Corona®, Stella Artois® and Michelob Ultra®; multi-country brands Beck’s®, Hoegaarden® and Leffe®; and local champions such as Aguila®, Antarctica®, Bud Light®, Brahma®, Cass®, Castle®, Castle Lite®, Cristal®, Harbin®, Jupiler®, Modelo Especial®, Quilmes®, Victoria®, Sedrin®, and Skol®. Our brewing heritage dates back more than 600 years, spanning continents and generations. From our European roots at the Den Hoorn brewery in Leuven, Belgium. To the pioneering spirit of the Anheuser & Co brewery in St. Louis, US. To the creation of the Castle Brewery in South Africa during the Johannesburg gold rush. To Bohemia, the first brewery in Brazil. Geographically diversified with a balanced exposure to developed and developing markets, we leverage the collective strengths of approximately 144 000 colleagues based in nearly 50 countries worldwide. For 2024, AB InBev’s reported revenue was 59.8 billion USD (excluding JVs and associates).
Annex 1: Segment reporting
|
AB InBev Worldwide |
1Q24 |
Scope |
Currency Translation |
Organic Growth |
1Q25 |
Organic Growth |
||||||||||||
|
Volumes |
139 536 |
|
(274 |
) |
- |
|
(2 993 |
) |
136 268 |
|
(2.2 |
)% |
||||||
|
Revenue |
14 547 |
|
(31 |
) |
(1 099 |
) |
210 |
|
13 628 |
|
1.5 |
% |
||||||
|
Cost of sales |
(6 653 |
) |
(64 |
) |
471 |
|
202 |
|
(6 044 |
) |
3.1 |
% |
||||||
|
Gross profit |
7 894 |
|
(96 |
) |
(627 |
) |
412 |
|
7 583 |
|
5.2 |
% |
||||||
|
SG&A |
(4 435 |
) |
(20 |
) |
324 |
|
(57 |
) |
(4 188 |
) |
(1.3 |
)% |
||||||
|
Other operating income/(expenses) |
183 |
|
14 |
|
(21 |
) |
17 |
|
192 |
|
9.1 |
% |
||||||
|
Normalized EBIT |
3 642 |
|
(103 |
) |
(324 |
) |
372 |
|
3 587 |
|
10.3 |
% |
||||||
|
Normalized EBITDA |
4 987 |
|
(100 |
) |
(424 |
) |
392 |
|
4 855 |
|
7.9 |
% |
||||||
|
Normalized EBITDA margin |
34.3 |
% |
35.6 |
% |
218bps |
|||||||||||||
|
|
||||||||||||||||||
|
North America |
1Q24 |
Scope |
Currency Translation |
Organic Growth |
1Q25 |
Organic Growth |
||||||||||||
|
Volumes |
21 353 |
|
(144 |
) |
- |
|
(1 368 |
) |
19 842 |
|
(6.4 |
)% |
||||||
|
Revenue |
3 593 |
|
(36 |
) |
(25 |
) |
(168 |
) |
3 364 |
|
(4.7 |
)% |
||||||
|
Cost of sales |
(1 544 |
) |
20 |
|
9 |
|
106 |
|
(1 410 |
) |
7.0 |
% |
||||||
|
Gross profit |
2 049 |
|
(16 |
) |
(17 |
) |
(62 |
) |
1 953 |
|
(3.0 |
)% |
||||||
|
SG&A |
(1 085 |
) |
(6 |
) |
11 |
|
29 |
|
(1 052 |
) |
2.7 |
% |
||||||
|
Other operating income/(expenses) |
(12 |
) |
- |
|
1 |
|
25 |
|
14 |
|
207.0 |
% |
||||||
|
Normalized EBIT |
951 |
|
(22 |
) |
(5 |
) |
(8 |
) |
916 |
|
(0.8 |
)% |
||||||
|
Normalized EBITDA |
1 126 |
|
(22 |
) |
(7 |
) |
(10 |
) |
1 087 |
|
(0.9 |
)% |
||||||
|
Normalized EBITDA margin |
31.3 |
% |
32.3 |
% |
125bps |
|||||||||||||
|
|
||||||||||||||||||
|
Middle Americas |
1Q24 |
Scope |
Currency Translation |
Organic Growth |
1Q25 |
Organic Growth |
||||||||||||
|
Volumes |
35 690 |
|
- |
|
- |
|
(610 |
) |
35 081 |
|
(1.7 |
)% |
||||||
|
Revenue |
4 051 |
|
(12 |
) |
(400 |
) |
144 |
|
3 784 |
|
3.6 |
% |
||||||
|
Cost of sales |
(1 586 |
) |
(14 |
) |
138 |
|
113 |
|
(1 350 |
) |
7.1 |
% |
||||||
|
Gross profit |
2 465 |
|
(26 |
) |
(262 |
) |
257 |
|
2 434 |
|
10.5 |
% |
||||||
|
SG&A |
(965 |
) |
6 |
|
101 |
|
(53 |
) |
(911 |
) |
(5.5 |
)% |
||||||
|
Other operating income/(expenses) |
12 |
|
- |
|
(2 |
) |
1 |
|
12 |
|
7.2 |
% |
||||||
|
Normalized EBIT |
1 512 |
|
(20 |
) |
(162 |
) |
204 |
|
1 535 |
|
13.6 |
% |
||||||
|
Normalized EBITDA |
1 886 |
|
(20 |
) |
(201 |
) |
192 |
|
1 858 |
|
10.3 |
% |
||||||
|
Normalized EBITDA margin |
46.6 |
% |
49.1 |
% |
300bps |
|||||||||||||
|
South America |
1Q24 |
Scope |
Currency Translation |
Organic Growth |
1Q25 |
Organic Growth |
||||||||||||
|
Volumes |
40 347 |
|
- |
|
- |
|
544 |
|
40 891 |
|
1.3 |
% |
||||||
|
Revenue |
3 233 |
|
45 |
|
(576 |
) |
276 |
|
2 978 |
|
8.5 |
% |
||||||
|
Cost of sales |
(1 586 |
) |
(89 |
) |
281 |
|
(56 |
) |
(1 450 |
) |
(3.5 |
)% |
||||||
|
Gross profit |
1 647 |
|
(43 |
) |
(295 |
) |
220 |
|
1 528 |
|
13.4 |
% |
||||||
|
SG&A |
(941 |
) |
(33 |
) |
168 |
|
(43 |
) |
(849 |
) |
(4.6 |
)% |
||||||
|
Other operating income/(expenses) |
116 |
|
8 |
|
(18 |
) |
(9 |
) |
97 |
|
(7.8 |
)% |
||||||
|
Normalized EBIT |
821 |
|
(68 |
) |
(145 |
) |
168 |
|
776 |
|
20.9 |
% |
||||||
|
Normalized EBITDA |
1 084 |
|
(65 |
) |
(192 |
) |
180 |
|
1 007 |
|
16.8 |
% |
||||||
|
Normalized EBITDA margin |
33.5 |
% |
33.8 |
% |
253bps |
|||||||||||||
|
EMEA |
1Q24 |
Scope |
Currency Translation |
Organic Growth |
1Q25 |
Organic Growth |
||||||||||||
|
Volumes |
21 030 |
|
(35 |
) |
- |
|
(243 |
) |
20 752 |
|
(1.2 |
)% |
||||||
|
Revenue |
1 927 |
|
(8 |
) |
(45 |
) |
91 |
|
1 965 |
|
4.8 |
% |
||||||
|
Cost of sales |
(1 036 |
) |
10 |
|
26 |
|
(29 |
) |
(1 028 |
) |
(2.8 |
)% |
||||||
|
Gross profit |
892 |
|
2 |
|
(18 |
) |
62 |
|
937 |
|
7.0 |
% |
||||||
|
SG&A |
(614 |
) |
(16 |
) |
16 |
|
7 |
|
(607 |
) |
1.1 |
% |
||||||
|
Other operating income/(expenses) |
44 |
|
5 |
|
(2 |
) |
(4 |
) |
44 |
|
(7.4 |
)% |
||||||
|
Normalized EBIT |
322 |
|
(8 |
) |
(4 |
) |
65 |
|
375 |
|
20.7 |
% |
||||||
|
Normalized EBITDA |
569 |
|
(8 |
) |
(10 |
) |
74 |
|
624 |
|
13.1 |
% |
||||||
|
Normalized EBITDA margin |
29.5 |
% |
31.7 |
% |
235bps |
|||||||||||||
|
|
||||||||||||||||||
|
Asia Pacific |
1Q24 |
Scope |
Currency Translation |
Organic Growth |
1Q25 |
Organic Growth |
||||||||||||
|
Volumes |
21 045 |
|
(93 |
) |
- |
|
(1 304 |
) |
19 648 |
|
(6.2 |
)% |
||||||
|
Revenue |
1 634 |
|
(7 |
) |
(52 |
) |
(125 |
) |
1 450 |
|
(7.7 |
)% |
||||||
|
Cost of sales |
(763 |
) |
(2 |
) |
23 |
|
58 |
|
(685 |
) |
7.6 |
% |
||||||
|
Gross profit |
871 |
|
(9 |
) |
(30 |
) |
(67 |
) |
766 |
|
(7.8 |
)% |
||||||
|
SG&A |
(445 |
) |
(3 |
) |
16 |
|
11 |
|
(420 |
) |
2.5 |
% |
||||||
|
Other operating income/(expenses) |
26 |
|
- |
|
- |
|
(1 |
) |
24 |
|
(4.7 |
)% |
||||||
|
Normalized EBIT |
452 |
|
(12 |
) |
(13 |
) |
(57 |
) |
369 |
|
(12.9 |
)% |
||||||
|
Normalized EBITDA |
616 |
|
(11 |
) |
(18 |
) |
(63 |
) |
523 |
|
(10.4 |
)% |
||||||
|
Normalized EBITDA margin |
37.7 |
% |
36.1 |
% |
(112)bps |
|||||||||||||
|
|
||||||||||||||||||
|
Global Export and Holding Companies |
1Q24 |
Scope |
Currency Translation |
Organic Growth |
1Q25 |
Organic Growth |
||||||||||||
|
Volumes |
70 |
|
(3 |
) |
- |
|
(13 |
) |
54 |
|
(19.2 |
)% |
||||||
|
Revenue |
109 |
|
(14 |
) |
(1 |
) |
(8 |
) |
86 |
|
(8.6 |
)% |
||||||
|
Cost of sales |
(138 |
) |
11 |
|
(5 |
) |
10 |
|
(122 |
) |
8.2 |
% |
||||||
|
Gross profit |
(29 |
) |
(3 |
) |
(6 |
) |
2 |
|
(36 |
) |
7.0 |
% |
||||||
|
SG&A |
(385 |
) |
31 |
|
12 |
|
(7 |
) |
(349 |
) |
(2.1 |
)% |
||||||
|
Other operating income/(expenses) |
(3 |
) |
- |
|
- |
|
4 |
|
1 |
|
118.8 |
% |
||||||
|
Normalized EBIT |
(417 |
) |
28 |
|
6 |
|
(1 |
) |
(384 |
) |
(0.2 |
)% |
||||||
|
Normalized EBITDA |
(295 |
) |
28 |
|
4 |
|
20 |
|
(244 |
) |
7.4 |
% |
||||||
Contacts
Investors
Shaun Fullalove
E-mail: shaun.fullalove@ab-inbev.com
Ekaterina Baillie
E-mail: ekaterina.baillie@ab-inbev.com
Cyrus Nentin
E-mail: cyrus.nentin@ab-inbev.com
Media
Media Relations
E-mail: media.relations@ab-inbev.com
AB InBev Strategic Priorities