HONG KONG--(BUSINESS WIRE)--Galaxy Entertainment Group (“GEG”, “Company” or the “Group”) (HKEx stock code: 27) today reported results for the three months and twelve months periods ended 31 December 2019. (All amounts are expressed in HKD unless otherwise stated)
LETTER FROM THE CHAIRMAN OF GALAXY ENTERTAINMENT GROUP
Fellow shareholders I wish to share with you my personal concern as a result of the outbreak of the coronavirus. As you are aware in late December 2019, the coronavirus was confirmed and many people have been impacted at different levels. I wish to express my heartfelt sympathy to all those affected and to their family and friends.
GEG is committed to the well-being and safety of all our guests and team members and to maintain high levels of hygiene. In light of the pneumonia outbreak, we have been working closely with the Macau Government and the relevant departments. We have adopted and supported all protective measures laid out by the Macau Government. From midnight 5 February 2020, the Macau Government instructed that all gaming premises suspend casino operations for 15 days, subsequently this suspension was lifted on Thursday, 20th February. In addition, we also reaccelerated work on our construction projects in Cotai. We acknowledge the closure may bring challenges to the industry and Macau’s economy, but GEG fully supports the government’s decision and believes that it is critical for society to unite. GEG has taken a wide range of protective measures against the coronavirus and we are working together to contain the spread of the virus.
GEG has donated MOP20 million through the Galaxy Entertainment Group Foundation to Hubei Province in order to help the region fight against the pneumonia outbreak and assist in relief efforts. The donation was made under the coordination of the Liaison Office of the Central People’s Government in the Macau SAR. We have also made a donation of MOP5 million to support the prevention initiatives in the Macau community. GEG also donated one million protective face masks to the Macau Government, Zhuhai City Government and Hengqin New Area Government in support of their prevention efforts.
It is times like this that the entire community needs to work together to overcome these challenges. We have faced similar challenges in the past, and we have overcome these previous challenges. I am confident that in time we will overcome the current challenge.
I would like to personally thank all of the related government departments and officials, emergency and medical personnel who have worked tirelessly to assist the community in this challenging time. I would also like to thank the GEG team members for their assistance during this period.
Thank you!
Dr. Lui Che Woo
GBM, MBE, JP, LLD, DSSc, DBA
Chairman
Q4 & FULL YEAR 2019 RESULTS HIGHLIGHTS
GEG: Strong Mass Performance, Solid VIP
- Full Year Group Net Revenue of $51.9 billion, down 6% year-on-year
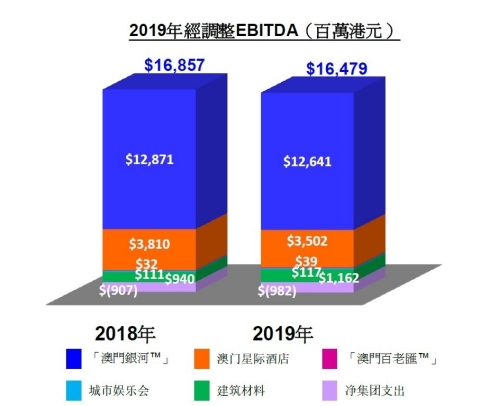
- Full Year Group Adjusted EBITDA of $16.5 billion, down 2% year-on-year
- Full Year net profit attributable to shareholders (“NPAS”) of $13.0 billion, down 3% year-on-year including $954 million of non-recurring and other charges
- Full year Adjusted NPAS of $14.0 billion, flat year-on-year after adjusting for non-recurring and other charges
- Q4 Group Net Revenue of $13.0 billion, down 8% year-on-year and up 2% quarter-on-quarter
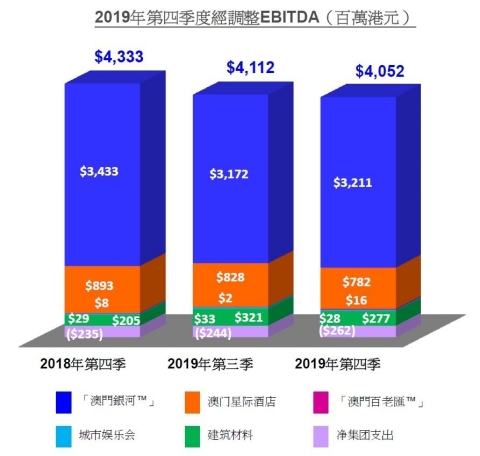
- Q4 Group Adjusted EBITDA of $4.1 billion, down 6% year-on-year and down 1% quarter-on-quarter
- Played lucky in Q4 which increased Adjusted EBITDA by approximately $180 million, normalized Q4 Adjusted EBITDA of $3.9 billion, down 9% year-on-year and down 1% quarter-on-quarter
Galaxy MacauTM: Strong Mass Performance, Property Enhancement Program on Track
- Full Year Net Revenue of $37.4 billion, down 5% year-on-year
- Full Year Adjusted EBITDA of $12.6 billion, down 2% year-on-year
- Q4 Net Revenue of $9.3 billion, down 10% year-on-year and flat quarter-on-quarter
- Q4 Adjusted EBITDA of $3.2 billion, down 6% year-on-year and up 1% quarter-on-quarter
- Played lucky in Q4 which increased Adjusted EBITDA by approximately $202 million, normalized Q4 Adjusted EBITDA of $3.0 billion, down 7% year-on-year and flat quarter-on-quarter
- Hotel occupancy for Q4 across the five hotels was virtually 100%
StarWorld Macau: Solid Mass Performance, Property Enhancement Program on Track
- Full Year Net Revenue of $10.9 billion, down 10% year-on-year
- Full Year Adjusted EBITDA of $3.5 billion, down 8% year-on-year
- Q4 Net Revenue of $2.7 billion, down 11% year-on-year and up 5% quarter-on-quarter
- Q4 Adjusted EBITDA of $782 million, down 12% year-on-year and down 6% quarter-on-quarter
- Played unlucky in Q4 which decreased Adjusted EBITDA by approximately $21 million, normalized Q4 Adjusted EBITDA of $803 million, down 20% year-on-year and down 1% quarter-on-quarter
- Hotel occupancy for Q4 was virtually 100%
Broadway Macau™: A Unique Family Friendly Resort, Strongly Supported by Macau SMEs
- Full Year Net Revenue of $593 million, versus $562 million in 2018
- Full Year Adjusted EBITDA of $39 million, versus $32 million in 2018
- Q4 Net Revenue of $154 million, versus $141 million in Q3 2019 and $144 million in Q4 2018
- Q4 Adjusted EBITDA of $16 million, versus $2 million in Q3 2019 and $8 million in Q4 2018
- Played unlucky in Q4 which decreased Adjusted EBITDA by approximately $1 million, normalized Q4 Adjusted EBITDA of $17 million, versus $4 million in Q3 2019 and $7 million in Q4 2018
- Hotel occupancy for Q4 was virtually 100%
Balance Sheet: Healthy and Liquid Balance Sheet
- As at 31 December 2019, cash and liquid investments were $52.3 billion and net cash was $51.7 billion
- As at 31 December 2019, debt was $0.6 billion
- Paid two special dividends of $0.45 per share in April 2019 and $0.46 per share in October 2019
- Announced another special dividend of $0.45 per share payable on or about 24 April 2020
Development Update: Continuing to Pursue Development Opportunities
- Property Enhancement Program – Almost completed the previously announced $1.5 billion property enhancement program in both Galaxy Macau™ and StarWorld Macau, we have identified and are reviewing additional enhancement opportunities
- Cotai Phases 3 & 4 – Continue with development works for Phases 3 & 4, with a strong focus on non-gaming, primarily targeting MICE, entertainment, family facilities and also including gaming
- GICC & Galaxy Arena - In August 2019 introduced Galaxy International Convention Center (GICC) and Galaxy Arena and are pleased to welcome Hyatt Hotels Corporation’s first Andaz Hotel to Macau and the Galaxy Integrated Resorts precinct
- Hengqin – Refining plans for a lifestyle resort to complement our high-energy entertainment resorts in Macau
- International – Continuously exploring opportunities in overseas markets, including Japan
Macau Market Overview
Investor sentiment throughout 2019 experienced periods of fluctuation. This was a result of a number of geo-political and economic issues such as Sino-US trade tensions, a slowing world economy, introduction of the VIP smoking ban, RMB fluctuation, continuing competition from regional markets and disruption in Hong Kong. GGR for the full year 2019 was $283.9 billion, down 3% year-on-year. GGR in Q4 2019 was $70.1 billion, down 8% year-on-year and up 2% quarter-on-quarter.
In 2019, visitor arrivals to Macau were 39.4 million, up 10% year-on-year, in which visitors from Mainland China accounted for 71% of all visitor arrivals. Visitors from Greater Bay Area grew 26% year-on-year. Overnight visitors accounted for 47% of total visitation. The average length of stay for overnight visitors remained at 2.2 days. Thanks to the further diversification of tourism product offerings in Macau, we also noticed a trend of changing visitor mix from Mainland China to Macau with more family oriented and younger visitors, according to data released by Ctrip.
Group Financial Results
Full Year 2019
The Group posted net revenue of $51.9 billion, down 6% year-on-year. Adjusted EBITDA was $16.5 billion, down 2% year-on-year. Net profit attributable to shareholders was $13.0 billion, down 3% year-on-year. Galaxy Macau™’s Adjusted EBITDA was $12.6 billion, down 2% year-on-year. StarWorld Macau’s Adjusted EBITDA was $3.5 billion, down 8% year-on-year. Broadway Macau™’s Adjusted EBITDA was $39 million versus $32 million in 2018.
GEG experienced good luck in its gaming operation during 2019, which increased its Adjusted EBITDA by approximately $824 million. Normalized 2019 Adjusted EBITDA was $15.7 billion, down 10% year-on-year.
The Group’s total GGR on a management basis1 in 2019 was $59.4 billion, down 12% year-on-year. Mass GGR was $29.3 billion, up 6% year-on-year. VIP GGR was $27.6 billion, down 26% year-on-year. Electronic GGR was $2.5 billion, up 2% year-on-year.
|
Group Key Financial Data |
|
|
|||||||||
|
(HK$'m) |
|
|
|||||||||
|
2018 |
2019 |
||||||||||
|
Revenues: |
|
|
|||||||||
|
Net Gaming |
47,025 |
43,582 |
|||||||||
|
Non-gaming |
5,298 |
5,486 |
|||||||||
|
Construction Materials |
2,888 |
2,834 |
|||||||||
|
Total Net Revenue |
55,211 |
51,902 |
|||||||||
|
Adjusted EBITDA |
16,857 |
16,479 |
|||||||||
|
|
|
|
|||||||||
|
Gaming Statistics2 |
|
|
|||||||||
|
(HK$'m) |
|
|
|||||||||
|
2018 |
2019 |
||||||||||
|
Rolling Chip Volume3 |
1,103,107 |
715,988 |
|||||||||
|
Win Rate % |
3.4% |
3.9% |
|||||||||
|
Win |
37,250 |
27,583 |
|||||||||
|
|
|
||||||||||
|
Mass Table Drop4 |
119,657 |
121,879 |
|||||||||
|
Win Rate % |
23.0% |
24.0% |
|||||||||
|
Win |
27,487 |
29,260 |
|||||||||
|
|
|
||||||||||
|
Electronic Gaming Volume |
72,461 |
67,942 |
|||||||||
|
Win Rate % |
3.4% |
3.7% |
|||||||||
|
Win |
2,476 |
2,513 |
|||||||||
|
|
|
|
|||||||||
|
Total GGR Win5 |
67,213 |
59,356 |
Balance Sheet and Special Dividends
As of 31 December 2019, cash and liquid investments were $52.3 billion and net cash was $51.7 billion. Total debt was $0.6 billion. Our balance sheet combined with cash flow from operations allows us to return capital to shareholders via dividends and to fund both our Macau development pipeline and international expansion ambitions.
During 2019, GEG returned capital to shareholders by paying two special dividends of $0.45 per share and $0.46 per share on 26 April 2019 and 25 October 2019 respectively. The Group announced another special dividend of $0.45 per share to be paid on or about 24 April 2020.
Q4 2019
During Q4 2019, the Group’s net revenue decreased 8% year-on-year and increased 2% quarter-on-quarter to $13.0 billion. Adjusted EBITDA decreased 6% year-on-year and decreased 1% quarter-on-quarter to $4.1 billion. Galaxy Macau™’s Adjusted EBITDA decreased 6% year-on-year and increased 1% quarter-on-quarter to $3.2 billion. StarWorld Macau’s Adjusted EBITDA decreased 12% year-on-year and decreased 6% quarter-on-quarter to $782 million. Broadway Macau™’s Adjusted EBITDA was $16 million versus $2 million in Q3 2019 and $8 million in Q4 2018.
During Q4 2019, GEG experienced good in its gaming operations which increased its Adjusted EBITDA by approximately $180 million. Normalized Q4 2019 Adjusted EBITDA decreased 9% year-on-year and decreased 1% quarter-on-quarter to $3.9 billion.
The Group’s total GGR on a management basis6 in Q4 2019 was $14.4 billion, down 15% year-on-year and up 1% quarter-on-quarter. Mass GGR was $7.3 billion, flat year-on-year and flat quarter-on-quarter. VIP GGR was $6.5 billion, down 28% year-on-year and up 1% quarter-on-quarter. Electronic GGR was $659 million, down 3% year-on-year and up 3% quarter-on-quarter.
|
Group Key Financial Data |
|
|
|
|
|
|||||||||||||||
|
(HK$'m) |
|
|
|
|
|
|||||||||||||||
|
Q4 2018 |
Q3 2019 |
Q4 2019 |
FY2018 |
FY2019 |
||||||||||||||||
|
Revenues: |
|
|
|
|
|
|||||||||||||||
|
Net Gaming |
12,138 |
10,603 |
10,745 |
47,025 |
43,582 |
|||||||||||||||
|
Non-gaming |
1,369 |
1,407 |
1,426 |
5,298 |
5,486 |
|||||||||||||||
|
Construction Materials |
651 |
700 |
802 |
2,888 |
2,834 |
|||||||||||||||
|
Total Net Revenue |
14,158 |
12,710 |
12,973 |
55,211 |
51,902 |
|||||||||||||||
|
|
|
|
|
|
||||||||||||||||
|
Adjusted EBITDA |
4,333 |
4,112 |
4,052 |
16,857 |
16,479 |
|||||||||||||||
|
|
|
|
|
|
|
|||||||||||||||
|
Gaming Statistics7 |
|
|
|
|
|
|||||||||||||||
|
(HK$'m) |
|
|
|
|
|
|||||||||||||||
|
Q4 2018 |
Q3 2019 |
Q4 2019 |
FY2018 |
FY2019 |
||||||||||||||||
|
Rolling Chip Volume8 |
260,505 |
163,779 |
168,975 |
1,103,107 |
715,988 |
|||||||||||||||
|
Win Rate % |
3.5% |
3.9% |
3.8% |
3.4% |
3.9% |
|||||||||||||||
|
Win |
9,034 |
6,369 |
6,460 |
37,250 |
27,583 |
|||||||||||||||
|
|
|
|
|
|
||||||||||||||||
|
Mass Table Drop9 |
31,571 |
30,424 |
30,601 |
119,657 |
121,879 |
|||||||||||||||
|
Win Rate % |
23.2% |
24.1% |
24.0% |
23.0% |
24.0% |
|||||||||||||||
|
Win |
7,328 |
7,319 |
7,330 |
27,487 |
29,260 |
|||||||||||||||
|
|
|
|
|
|
||||||||||||||||
|
Electronic Gaming Volume |
18,191 |
17,133 |
17,984 |
72,461 |
67,942 |
|||||||||||||||
|
Win Rate % |
3.7% |
3.7% |
3.7% |
3.4% |
3.7% |
|||||||||||||||
|
Win |
681 |
641 |
659 |
2,476 |
2,513 |
|||||||||||||||
|
|
|
|
|
|
|
|||||||||||||||
|
Total GGR Win |
17,043 |
14,329 |
14,449 |
67,213 |
59,356 |
Galaxy Macau™
Galaxy Macau™ is the primary contributor to Group revenue and earnings. In 2019, net revenue was down 5% year-on-year to $37.4 billion. Adjusted EBITDA was down 2% year-on-year to $12.6 billion. Adjusted EBITDA margin under HKFRS was 34% (2018: 33%). Galaxy Macau™ experienced good luck in its gaming operations which increased its Adjusted EBITDA by approximately $665 million. Normalized 2019 Adjusted EBITDA decreased 10% year-on-year to $12.0 billion.
In Q4 2019, Galaxy Macau™’s net revenue was $9.3 billion, down 10% year-on-year and flat quarter-on-quarter. Adjusted EBITDA was $3.2 billion, down 6% year-on-year and up 1% quarter-on-quarter. Adjusted EBITDA margin under HKFRS was 34% (Q4 2018: 33%). Galaxy Macau™ experienced good luck in its gaming operations which increased its Adjusted EBITDA by approximately $202 million. Normalized Q4 2019 Adjusted EBITDA decreased 7% year-on-year and was flat quarter-on-quarter to $3.0 billion.
The combined five hotels registered strong occupancy at virtually 100% for both the full year and Q4 2019.
|
Galaxy Macau™ Key Financial Data |
||||||||||||||||||||
|
(HK$'m) |
Q4 2018 |
Q3 2019 |
Q4 2019 |
FY2018 |
FY2019 |
|||||||||||||||
|
Revenues: |
|
|
|
|
|
|||||||||||||||
|
Net Gaming |
9,201 |
8,108 |
8,137 |
34,983 |
32,780 |
|||||||||||||||
|
Hotel / F&B / Others |
858 |
897 |
872 |
3,385 |
3,430 |
|||||||||||||||
|
Mall |
302 |
310 |
327 |
1,123 |
1,231 |
|||||||||||||||
|
Total Net Revenue |
10,361 |
9,315 |
9,336 |
39,491 |
37,441 |
|||||||||||||||
|
Adjusted EBITDA |
3,433 |
3,172 |
3,211 |
12,871 |
12,641 |
|||||||||||||||
|
Adjusted EBITDA Margin |
33% |
34% |
34% |
33% |
34% |
|||||||||||||||
|
|
|
|
|
|
|
|||||||||||||||
|
Gaming Statistics10 |
|
|
|
|
|
|||||||||||||||
|
(HK$'m) |
Q4 2018 |
Q3 2019 |
Q4 2019 |
FY2018 |
FY2019 |
|||||||||||||||
|
Rolling Chip Volume11 |
172,378 |
110,279 |
114,669 |
775,429 |
485,343 |
|||||||||||||||
|
Win Rate % |
3.8% |
4.4% |
4.0% |
3.5% |
4.2% |
|||||||||||||||
|
Win |
6,612 |
4,805 |
4,612 |
27,423 |
20,171 |
|||||||||||||||
|
|
|
|
|
|
||||||||||||||||
|
Mass Table Drop12 |
18,593 |
18,403 |
18,359 |
70,286 |
72,786 |
|||||||||||||||
|
Win Rate % |
27.8% |
27.9% |
28.4% |
26.7% |
28.0% |
|||||||||||||||
|
Win |
5,178 |
5,129 |
5,221 |
18,746 |
20,411 |
|||||||||||||||
|
|
|
|
|
|
||||||||||||||||
|
Electronic Gaming Volume |
12,851 |
11,359 |
11,872 |
52,778 |
45,572 |
|||||||||||||||
|
Win Rate % |
4.5% |
4.6% |
4.5% |
3.9% |
4.6% |
|||||||||||||||
|
Win |
573 |
523 |
539 |
2,082 |
2,076 |
|||||||||||||||
|
|
|
|
|
|
|
|||||||||||||||
|
Total GGR Win |
12,363 |
10,457 |
10,372 |
48,251 |
42,658 |
|||||||||||||||
StarWorld Macau
In 2019, StarWorld Macau’s net revenue was down 10% year-on-year to $10.9 billion. Adjusted EBITDA was down 8% year-on-year to $3.5 billion. Adjusted EBITDA margin under HKFRS was 32% (2018: 31%). StarWorld Macau experienced good luck in its gaming operations which increased its Adjusted EBITDA by approximately $154 million. Normalized 2019 Adjusted EBITDA decreased 13% year-on-year to $3.3 billion.
In Q4 2019, StarWorld Macau’s net revenue was $2.7 billion, down 11% year-on-year and up 5% quarter-on-quarter. Adjusted EBITDA was $782 million, down 12% year-on-year and down 6% quarter-on-quarter. Adjusted EBITDA margin under HKFRS was 29% (Q4 2018: 30%). StarWorld Macau experienced bad luck in its gaming operations which decreased its Adjusted EBITDA by approximately $21 million. Normalized Q4 2019 Adjusted EBITDA decreased 20% year-on-year and decreased 1% quarter-on-quarter to $803 million.
Hotel occupancy was virtually 100% for both the full year and Q4 2019.
|
StarWorld Macau Key Financial Data |
||||||||||||||||||||
|
(HK$’m) |
|
|
|
|
|
|||||||||||||||
|
Q4 2018 |
Q3 2019 |
Q4 2019 |
FY2018 |
FY2019 |
||||||||||||||||
|
Revenues: |
|
|
|
|
|
|||||||||||||||
|
Net Gaming |
2,839 |
2,397 |
2,515 |
11,659 |
10,403 |
|||||||||||||||
|
Hotel / F&B / Others |
121 |
111 |
125 |
449 |
461 |
|||||||||||||||
|
Mall |
13 |
13 |
13 |
51 |
53 |
|||||||||||||||
|
Total Net Revenue |
2,973 |
2,521 |
2,653 |
12,159 |
10,917 |
|||||||||||||||
|
Adjusted EBITDA |
893 |
828 |
782 |
3,810 |
3,502 |
|||||||||||||||
|
Adjusted EBITDA Margin |
30% |
33% |
29% |
31% |
32% |
|||||||||||||||
|
|
|
|
|
|
|
|||||||||||||||
|
Gaming Statistics13 |
|
|
|
|
|
|||||||||||||||
|
(HK$'m) |
|
|
|
|
|
|||||||||||||||
|
Q4 2018 |
Q3 2019 |
Q4 2019 |
FY2018 |
FY2019 |
||||||||||||||||
|
Rolling Chip Volume14 |
87,317 |
49,990 |
50,539 |
323,063 |
222,014 |
|||||||||||||||
|
Win Rate % |
2.7% |
2.8% |
3.5% |
3.0% |
3.2% |
|||||||||||||||
|
Win |
2,386 |
1,394 |
1,770 |
9,654 |
7,118 |
|||||||||||||||
|
|
|
|
|
|
||||||||||||||||
|
Mass Table Drop15 |
9,620 |
8,915 |
9,217 |
36,375 |
36,274 |
|||||||||||||||
|
Win Rate % |
16.9% |
19.0% |
17.5% |
18.5% |
18.7% |
|||||||||||||||
|
Win |
1,630 |
1,694 |
1,614 |
6,723 |
6,787 |
|||||||||||||||
|
|
|
|
|
|
||||||||||||||||
|
Electronic Gaming Volume |
2,010 |
2,226 |
2,421 |
7,585 |
8,632 |
|||||||||||||||
|
Win Rate % |
2.1% |
2.5% |
2.2% |
2.3% |
2.3% |
|||||||||||||||
|
Win |
42 |
55 |
55 |
172 |
196 |
|||||||||||||||
|
|
|
|
|
|
|
|||||||||||||||
|
Total GGR Win |
4,058 |
3,143 |
3,439 |
16,549 |
14,101 |
|||||||||||||||
Broadway Macau™
Broadway Macau™ is a unique family friendly, street entertainment and food resort supported by Macau SMEs, it does not have a VIP gaming component. In 2019, Broadway Macau™’s net revenue was $593 million, versus $562 million in 2018. Adjusted EBITDA was $39 million versus $32 million in 2018. Adjusted EBITDA margin under HKFRS was 7% (2018: 6%). Broadway Macau™ experienced good luck in its gaming operations which increased its Adjusted EBITDA by approximately $5 million. Normalized 2019 Adjusted EBITDA was $34 million versus $34 million in 2018.
In Q4 2019, Broadway Macau™’s net revenue was $154 million, versus $144 million in Q4 2018. Adjusted EBITDA was $16 million, versus $8 million in prior year and $2 million in Q3 2019. Adjusted EBITDA margin under HKFRS increased to 10% (Q4 2018: 6%). Broadway Macau™ experienced bad luck in its gaming operations which decreased its Adjusted EBITDA by approximately $1 million. Normalized Q4 2019 Adjusted EBITDA was $17 million, versus $7 million in prior year and $4 million in Q3 2019.
Hotel occupancy was virtually 100% for Q4 and full year 2019.
|
Broadway Macau™ Key Financial Data |
||||||||||||||||||||
|
(HK$'m) |
|
|
|
|
|
|||||||||||||||
|
Q4 2018 |
Q3 2019 |
Q4 2019 |
FY2018 |
FY2019 |
||||||||||||||||
|
Revenues: |
|
|
|
|
|
|||||||||||||||
|
Net Gaming |
69 |
65 |
65 |
272 |
282 |
|||||||||||||||
|
Hotel / F&B / Others |
63 |
66 |
78 |
246 |
267 |
|||||||||||||||
|
Mall |
12 |
10 |
11 |
44 |
44 |
|||||||||||||||
|
Total Net Revenue |
144 |
141 |
154 |
562 |
593 |
|||||||||||||||
|
Adjusted EBITDA |
8 |
2 |
16 |
32 |
39 |
|||||||||||||||
|
Adjusted EBITDA Margin |
6% |
1% |
10% |
6% |
7% |
|||||||||||||||
|
|
|
|
|
|
|
|||||||||||||||
|
Gaming Statistics16 |
|
|
|
|
|
|||||||||||||||
|
(HK$'m) |
|
|
|
|
|
|||||||||||||||
|
Q4 2018 |
Q3 2019 |
Q4 2019 |
FY2018 |
FY2019 |
||||||||||||||||
|
Mass Table Drop17 |
346 |
329 |
320 |
1,404 |
1,334 |
|||||||||||||||
|
Win Rate % |
18.9% |
19.2% |
19.1% |
18.4% |
20.0% |
|||||||||||||||
|
Win |
65 |
63 |
61 |
259 |
267 |
|||||||||||||||
|
|
|
|
|
|
||||||||||||||||
|
Electronic Gaming Volume |
574 |
454 |
471 |
2,008 |
1,923 |
|||||||||||||||
|
Win Rate % |
2.3% |
2.3% |
2.3% |
2.3% |
2.4% |
|||||||||||||||
|
Win |
13 |
10 |
11 |
46 |
47 |
|||||||||||||||
|
|
|
|
|
|
|
|||||||||||||||
|
Total GGR Win |
78 |
73 |
72 |
305 |
314 |
|||||||||||||||
City Clubs
City Clubs contributed $117 million of Adjusted EBITDA to the Group’s earnings for 2019 versus $111 million in 2018. Q4 2019 Adjusted EBITDA was $28 million, down 3% year-on-year, down 15% quarter-on-quarter.
|
City Clubs Key Financial Data |
||||||||||||||||||||
|
(HK$'m) |
Q4 2018 |
Q3 2019 |
Q4 2019 |
FY2018 |
FY2019 |
|||||||||||||||
|
Adjusted EBITDA |
29 |
33 |
28 |
111 |
117 |
|||||||||||||||
|
|
|
|
|
|
|
|||||||||||||||
|
Gaming Statistics18 |
|
|
|
|
|
|||||||||||||||
|
(HK$'m) |
|
|
|
|
|
|||||||||||||||
|
Q4 2018 |
Q3 2019 |
Q4 2019 |
FY2018 |
FY2019 |
||||||||||||||||
|
Rolling Chip Volume19 |
810 |
3,510 |
3,767 |
4,615 |
8,631 |
|||||||||||||||
|
Win Rate % |
4.4% |
4.9% |
2.1% |
3.7% |
3.4% |
|||||||||||||||
|
Win |
36 |
170 |
78 |
173 |
294 |
|||||||||||||||
|
|
|
|
|
|
|
|||||||||||||||
|
Mass Table Drop20 |
3,012 |
2,777 |
2,705 |
11,592 |
11,485 |
|||||||||||||||
|
Win Rate % |
15.1% |
15.6% |
16.1% |
15.2% |
15.6% |
|||||||||||||||
|
Win |
455 |
433 |
434 |
1,759 |
1,795 |
|||||||||||||||
|
|
|
|
|
|
||||||||||||||||
|
Electronic Gaming Volume |
2,756 |
3,094 |
3,220 |
10,090 |
11,815 |
|||||||||||||||
|
Win Rate % |
1.9% |
1.7% |
1.7% |
1.7% |
1.6% |
|||||||||||||||
|
Win |
53 |
53 |
54 |
176 |
194 |
|||||||||||||||
|
|
|
|
|
|
|
|||||||||||||||
|
Total GGR Win |
544 |
656 |
566 |
2,108 |
2,283 |
|||||||||||||||
Construction Materials Division
The Construction Materials Division contributed Adjusted EBITDA of $1.2 billion in 2019, up 24% year-on-year. Q4 2019 Adjusted EBITDA was $277 million, up 35% year-on-year and down 14% quarter-on-quarter.
Development Update
Galaxy Macau™ and StarWorld Macau
We have almost completed the previously announced $1.5 billion property enhancement program in both Galaxy Macau™ and StarWorld Macau, and we have identified and are reviewing additional enhancement opportunities.
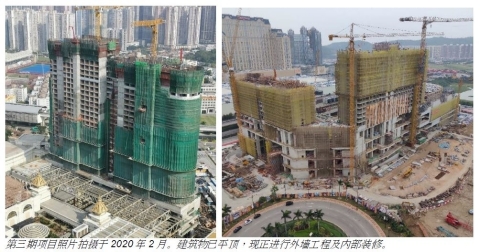
Cotai – The Next Chapter
GEG is uniquely positioned for long term growth. Our development works for Phases 3 & 4 include approximately 4,000 hotel rooms and villas, including family and premium high end rooms, 400,000 square feet of MICE space, a 500,000 square feet 16,000-seat multi-purpose arena, F&B, retail and casinos, among others. In August 2019 we introduced Galaxy International Convention Center (GICC) and Galaxy Arena and we are pleased to welcome Hyatt Hotel Corporation’s first Andaz Hotel to Macau and the Galaxy Integrated Resorts precinct.
Hengqin
We continue to make progress with our concept plan for a lifestyle resort on Hengqin that will complement our high energy resorts in Macau.
International
Our Japan based team continues with our Japan development efforts. We view Japan as a great long term growth opportunity that will complement our Macau operations and our other international expansion ambitions. GEG, together with Monte-Carlo SBM from the Principality of Monaco and our Japanese partners, look forward to bringing our brand of World Class Integrated Resorts to Japan. We continue to strengthen our Japan Development team and build our resources as we move forward in the Integrated Resorts process.
Selected Major Awards in 2019
|
Award |
Presenter |
|
GEG |
|
|
Gaming Operator of the Year Australia & Asia |
12th International Gaming Awards |
|
Overall Most Outstanding Company in Hong Kong
Most Outstanding Company in Hong Kong – Casinos & Gaming Sector |
Asiamoney |
|
3 Years IR Awards Winning Company
Certificate of Excellence |
Hong Kong Investor Relations Association |
|
Business Awards of Macau 2019 – Gold Award in Corporate Social Responsibility |
Business Awards of Macau |
|
10th Guangdong, Hong Kong and Macau Safety Knowledge Competition – Macau Leg – Champion in Corporation Category |
Labour Affairs Bureau (DSAL) |
|
Outstanding Disabled Employees and Talent Recognizing Employers Award Program 2019 – Talent Recognizing Employer Award |
Social Welfare Bureau (IAS) , Labour Affairs Bureau (DSAL) |
|
2019 Macau Outstanding Corporate Volunteer Award |
Association of Volunteers Social Service Macao |
|
Galaxy MacauTM |
|
|
Integrated Resort of the Year |
12th International Gaming Awards |
|
Best Integrated Resort Award
Best Gaming Floor Award |
G2E Asia Awards 2019 |
|
Asia’s Most Popular Parent-Child Travel Resort City Supreme Award |
The 19th Golden Horse Awards of China |
|
StarWorld Macau |
|
|
Asia’s Best Catering Service Hotel Supreme Award |
The 19th Golden Horse Awards of China |
|
TOP 10 City-Nova Hotels of China |
The 14th China Hotel Starlight Awards |
|
2019 Luxury Casino Hotel Global Winner |
World Luxury Hotel Awards |
|
Top Class Comfort Hotel |
The Michelin Guide Hong Kong Macau 2020 |
|
Broadway MacauTM |
|
|
2018 Macau Green Hotel Awards - Silver Award |
Environmental Protection Bureau |
|
2019 Macau Smart Hotel Awards – Excellent Communication Service Award |
Macao Post and Telecommunications Bureau (CTT) |
|
Construction Materials Division |
|
|
The 14th Occupational Health Award - Joyful @ Healthy Workplace Best Practices Award - Excellence Award |
Occupational Safety and Health Council |
|
Caring Company Scheme – 15 Years Plus Caring Company Logo |
The Hong Kong Council of Social Service |
|
Hong Kong Awards for Environmental Excellence
Hong Kong Green Organisation Certification - Wastewi$e Certificate - Excellence Level - Carbon Reduction - Certificate |
Environmental Campaign Committee |
|
Corporate Environmental Leadership Awards 2018 – EcoPartner |
Federation of Hong Kong Industries Bank of China (Hong Kong) |
|
18th Hong Kong Occupational Safety & Health Award – Safety Management System Award – Other Industries – Bronze Award
18th Hong Kong Occupational Safety & Health Award – Safety Performance Award – Other Industries |
Labour Department / Occupational Safety and Health Council |
Outlook
In December 2019, the coronavirus was discovered in Wuhan China. The Central Government has dedicated significant resources to combat the virus. All the concessionaires are working diligently with the Macau government to minimize the impact of the virus. GEG is committed to providing a safe and healthy environment for all our guests and staff and we will continue to remain alert for the incident.
Consumer spending in 2019 was impacted by a range of geo-political and economic issues such as Sino-US trade tensions and a slowing Chinese economy. In mid-January 2020, China and the United States signed a trade agreement, this has resulted in a more positive consumer outlook. Additionally, infrastructure continues to improve, in particular, the targeted early-2020 opening of the train line which extends from Zhuhai to Hengqin and the associated new immigration center, as well as the already commenced Macau Light Rail Transport (LRT) in Taipa which increases the ease of travel to and within Macau. Having said that, we expect Macau may continue to experience geo-political and economic challenges that may have an impact on consumer confidence in 2020.
At this point in time we cannot determine the duration of the coronavirus and therefore we are not yet able to quantify the full financial impact. We wish to highlight that a prolonged coronavirus crisis may have a material effect on our 2020 financial results and our development projects in Macau.
It is premature to forecast when the coronavirus will be controlled. However we remain confident in the longer term outlook for Macau in general, and GEG specifically. We are working closely with the new Macau SAR Government led by Chief Executive Mr. Ho Iat Seng. GEG is committed to invest in Macau’s economic diversification and support Macau to develop into a World Centre of Tourism and Leisure. Furthermore, we will continue to support the Central Government’s Greater Bay Area integration plan which will further facilitate the flow of people, logistics and capital within Macau, Hong Kong and the nine cities of southern Guangdong. GEG will continue to leverage on the plan by enhancing the competitiveness of our resort portfolio, including our development plan on Hengqin.
GEG will continue to focus on driving every segment of our business by allocating resources to their highest and best use. Mainland China has significant demand for leisure, tourism and travel and GEG is uniquely positioned to capitalize on this future growth potential having the largest development pipeline in Macau with Phases 3 & 4.
Our strong and healthy balance sheet allows us to return capital to shareholders through special dividends and fund both our Macau development pipeline and international expansion opportunities. These include Cotai Phases 3 & 4, Hengqin and Japan.
Finally we are working diligently to ensure the health and safety of our staff and guests.
About Galaxy Entertainment Group (HKEx stock code: 27)
Galaxy Entertainment Group (“GEG” or the “Group”) is one of the world’s leading resorts, hospitality and gaming companies. It primarily develops and operates a large portfolio of integrated resort, retail, dining, hotel and gaming facilities in Macau. The Group is listed on the Hong Kong Stock Exchange and is a constituent stock of the Hang Seng Index.
GEG is one of the three original concessionaires in Macau with a successful track record of delivering innovative, spectacular and award-winning properties, products and services, underpinned by a “World Class, Asian Heart” service philosophy, that has enabled it to consistently outperform the market in Macau.
GEG operates three flagship destinations in Macau: on Cotai, Galaxy Macau™, one of the world’s largest integrated destination resorts, and the adjoining Broadway Macau™, a unique landmark entertainment and food street destination; and on the Peninsula, StarWorld Macau, an award winning premium property.
The Group has the largest undeveloped landbank of any concessionaire in Macau. When The Next Chapter of its Cotai development is completed, GEG’s resorts footprint on Cotai will double to more than 2 million square meters, making the resorts, entertainment and MICE precinct one of the largest and most diverse integrated destinations in the world. GEG is also planning to develop a world class, lifestyle leisure resort on a 2.7 square kilometer land parcel on Hengqin adjacent to Macau. This resort will complement GEG’s offerings in Macau, and at the same time differentiate it from its peers while supporting Macau in its vision of becoming a World Centre of Tourism and Leisure.
In July 2015, GEG made a strategic investment in Société Anonyme des Bains de Mer et du Cercle des Etrangers à Monaco (“Monte-Carlo SBM”), a world renowned owner and operator of iconic luxury hotels and resorts in the Principality of Monaco. GEG continues to explore a range of international development opportunities with Monte-Carlo SBM including Japan.
GEG is committed to delivering world class unique experiences to its guests and building a sustainable future for the communities in which it operates.
For more information about the Group, please visit www.galaxyentertainment.com
1 The primary difference between statutory gross revenue and management basis gross revenue is the treatment of City Clubs revenue where fee income is reported on a statutory basis and gross gaming revenue is reported on a management basis. At the group level the gaming statistics include Company owned resorts plus City Clubs.
2 Gaming statistics are presented before deducting commission and incentives.
3 Reflects junket rolling chip volume only.
4 Mass table drop includes the amount of table drop plus cash chips purchased at the cage.
5 Total GGR win includes gaming win from City Clubs.
6 The primary difference between statutory gross revenue and management basis gross revenue is the treatment of City Clubs revenue where fee income is reported on a statutory basis and gross gaming revenue is reported on a management basis. At the group level the gaming statistics include Company owned resorts plus City Clubs.
7 Gaming statistics are presented before deducting commission and incentives.
8 Reflects junket rolling chip volume only.
9 Mass table drop includes the amount of table drop plus cash chips purchased at the cage.
10 Gaming statistics are presented before deducting commission and incentives.
11 Reflects junket rolling chip volume only.
12 Mass table drop includes the amount of table drop plus cash chips purchased at the cage.
13 Gaming statistics are presented before deducting commission and incentives.
14 Reflect junket rolling volume only.
15 Mass table drop includes the amount of table drop plus cash chips purchased at the cage.
16 Gaming statistics are presented before deducting commission and incentives.
17 Mass table drop includes the amount of table drop plus cash chips purchased at the cage.
18 Gaming statistics are presented before deducting commission and incentives.
19 Reflects junket rolling chip volume only.
20 Mass table drop includes the amount of table drop plus cash chips purchased at the cage.