HONG KONG--(BUSINESS WIRE)--Galaxy Entertainment Group (“GEG”, “Company” or the “Group”) (HKEx stock code: 27) today reported results for the three months and six months periods ended 30 June 2019. (All amounts are expressed in Hong Kong dollars unless otherwise stated)
Q2 & INTERIM 2019 RESULTS HIGHLIGHTS
GEG: Solid Mass Performance, Challenging VIP Segment
- 1H Group Net Revenue of $26.2 billion, down 7% year-on-year
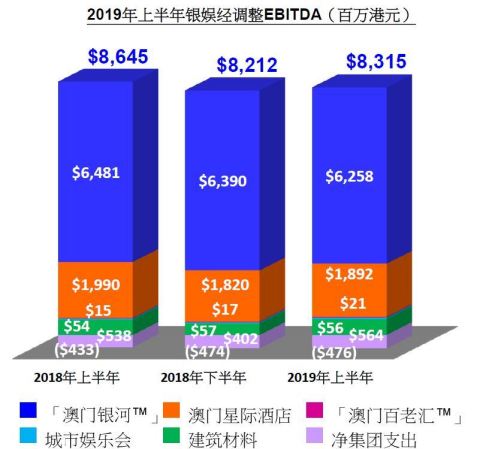
- 1H Group Adjusted EBITDA of $8.3 billion, down 4% year-on-year
- 1H Net Profit Attributable to Shareholders (“NPAS”) of $6.7 billion, down 7% year-on-year
- Q2 Group Net Revenue of $13.2 billion, down 5% year-on-year and up 1% quarter-on-quarter
- Q2 Group Adjusted EBITDA of $4.3 billion, flat year-on-year and up 9% quarter-on-quarter
- Played lucky in Q2 which increased Adjusted EBITDA by approximately $349 million, normalized Q2 Adjusted EBITDA of $4.0 billion, down 11% year-on-year and up 3% quarter-on-quarter
- LTM Adjusted EBITDA of $16.5 billion, up 1% year-on-year
Galaxy Macau™: Solid Mass Performance, Property Enhancement Program on Track
- 1H Net Revenue of $18.8 billion, down 5% year-on-year
- 1H Adjusted EBITDA of $6.3 billion, down 3% year-on-year
- Q2 Net Revenue of $9.5 billion, down 4% year-on-year and up 3% quarter-on-quarter
- Q2 Adjusted EBITDA of $3.2 billion, flat year-on-year and up 7% quarter-on-quarter
- Played lucky in Q2 which increased Adjusted EBITDA by approximately $253 million, normalized Q2 Adjusted EBITDA of $3.0 billion, down 11% year-on-year and flat quarter-on-quarter
- Hotel occupancy for Q2 across the five hotels was virtually 100%
StarWorld Macau: Solid Mass Performance, Property Enhancement Program on Track
- 1H Net Revenue of $5.7 billion, down 8% year-on-year
- 1H Adjusted EBITDA of $1.9 billion, down 5% year-on-year
- Q2 Net Revenue of $2.8 billion, down 10% year-on-year and down 8% quarter-on-quarter
- Q2 Adjusted EBITDA of $943 million, down 4% year-on-year and down 1% quarter-on-quarter
- Played lucky in Q2 which increased Adjusted EBITDA by approximately $92 million, normalized Q2 Adjusted EBITDA of $851 million, down 14% year-on-year and down 3% quarter-on-quarter
- Hotel occupancy for Q2 was virtually 100%
Broadway Macau™: A Unique Family Friendly Resort, Strongly Supported By Macau SMEs
- 1H Net Revenue of $298 million versus $273 million in 1H 2018
- 1H Adjusted EBITDA of $21 million versus $15 million in 1H 2018
- Q2 Net Revenue of $147 million versus $131 million in Q2 2018 and $151 million in Q1 2019
- Q2 Adjusted EBITDA of $6 million versus $2 million in Q2 2018 and $15 million in Q1 2019
- Played lucky in Q2 which increased Adjusted EBITDA by approximately $4 million, normalized Q2 Adjusted EBITDA of $2 million versus $4 million in Q2 2018 and $11 million in Q1 2019
- Hotel occupancy for Q2 was virtually 100%
Balance Sheet: Maintains a Healthy and Liquid Balance Sheet
- Cash and liquid investments were $50.4 billion and net cash of $43.9 billion as at 30 June 2019
- Debt of $6.5 billion as at 30 June 2019 primarily associated with treasury yield management program
- Paid the previously announced special dividend of $0.45 per share on 26 April 2019
- Subsequently announced another special dividend of $0.46 per share to be paid on or about 25 October 2019
Development Update: Continue to Pursue Development Opportunities
- Continue to progress with the previously announced $1.5 billion renovation enhancement program in both Galaxy Macau™ and StarWorld Macau, short term this has caused some disruption
- Cotai Phases 3 & 4 – Continue with development works for Phases 3 & 4, with a strong focus on non-gaming, primarily targeting MICE, entertainment, family facilities and also including gaming
- Hengqin – Refining our plans for a lifestyle resort to complement our high-energy entertainment resorts in Macau
- International – Continuously exploring opportunities in overseas markets, including Japan
Dr. Lui Che Woo, Chairman of GEG said:
“Today I am pleased to report the second quarter and half year results of the Group in 2019. This year is an important year for China and Macau with a particular focus on three major events. These include celebrating the 70th anniversary of the founding of the People’s Republic of China, it is also the 20th anniversary of the return of Macau to China. Further, we look forward to the election of the next Chief Executive in twelve days on August 25th.
For first half of 2019, Group Net Revenue decreased 7% year-on-year to $26.2 billion and Adjusted EBITDA decreased 4% year-on-year to $8.3 billion. In Q2 2019, the Group delivered Adjusted EBITDA of $4.3 billion, an increase of 9% quarter-on-quarter. Our balance sheet continued to be solid with total cash and liquid investments of $50.4 billion and net cash of $43.9 billion. Our balance sheet and cash flow from operations allows us to return capital to shareholders through dividends, fund our development pipeline and our pursue international expansion ambitions.
On 26 April 2019 we paid a special dividend of $0.45 per share and today we are pleased to announce another special dividend of $0.46 per share payable on or about 25 October 2019. These dividends demonstrate our confidence in the longer term outlook for Macau and for the Company.
The overall market in Macau remains relatively stable despite a decrease in VIP volumes due to increasing regional competition, ongoing trade tensions and a slowing Chinese economy. We continue to reallocate our resources to the highest and best use and focus on growing the higher margin Mass business.
We have continued to make good progress with our previously announced $1.5 billion property enhancement program. We believe these property enhancements will ensure the continuing attractiveness and competitive position of both Galaxy Macau™ and StarWorld Macau. In the shorter term some customer disruption will occur but medium term the program will create shareholder value.
Furthermore, we continue our construction works in Cotai Phases 3 & 4 and review international expansion opportunities on a case by case basis. In Japan we continue to build relationships with the community through activities such as sponsoring the EUROJAPAN CUP 2019 and the Japan-Macau Integrated Resort Management Mentorship Pilot Scheme in conjunction with the Macau University and Toyo University. In the medium to longer term, we remain confident in the outlook for Macau due to the increasing wealth of the middle class in Mainland China, that will in turn result in the growth of demand for tourism, leisure and travel.
We are pleased with the opening of Hong Kong-Zhuhai-Macau Bridge and look forward to the opening of Guangzhou-Zhuhai Intercity Railway expansion line to Hengqin which will make Cotai even more accessible. With the continued opening of infrastructure that allows easier access to Macau and the implementation of the Greater Bay Area integration plan we believe that this will further facilitate the flow of people, logistics and capital within Macau, Hong Kong and the nine cities of southern Guangdong.
We do acknowledge in the shorter term the continued discussions on international trade can have an impact on consumer sentiment and spending habits. We remain committed to support the Macau Government’s vision to develop Macau into a ‘World Center of Tourism and Leisure’.
Finally, I would like to thank all of our team members who deliver ‘World Class, Asian Heart’ service each and every day and contribute to the success of the Group.”
Market Overview
Based on DICJ reporting, Macau’s GGR for the first half of 2019 was down 0.5% year-on-year to $145.1 billion. Q2 2019 GGR was down 1% year-on-year and down 4% quarter-on-quarter to $71.2 billion.
In the first half of 2019, visitor arrivals to Macau were 20.3 million, up 21% year-on-year, in which overnight visitors grew at 8% year-on-year and same-day visitors grew by 34% year-on-year. The average length of stay for overnight visitors was flat at 2.2 days year-on-year. Mainland visitor arrivals to Macau were 14.3 million, up 22% year-on-year, demonstrating that the opening of the Hong Kong-Zhuhai-Macau Bridge and the high-speed train have successfully grown visitations to Macau.
During the first half of 2019, Macau experienced a number of events that impacted the market, most notably in the VIP segment. These included the introduction of smoking lounges in the VIP rooms, the slowing world economy and increased competition from new capacity and also greater competition from regional casinos. In the longer term Macau’s VIP business will remain competitive.
The introduction of smoking lounges on 1 January 2019 has been received by our employees and guests. As a result of GEG installing new smoking lounges throughout the resort, we have seen players redistributed throughout the property resulting in selected areas being less congested as previously, thereby resulting in an overall enhanced customer experience.
From April 2019, mainland residents were granted greater access to visas and can apply for travel visas to Macau at any immigration administration center across the country. At the same time, the State Council has approved the plan for the construction of Hengqin International Leisure Tourism Island. This plan may boost cooperation between Guangdong, Macau and Hong Kong and promote Macau’s economic diversification, so as to push forward the development of the Greater Bay Area.
Group Financial Results
1H 2019
The Group’s 1H 2019 results posted Net Revenue of $26.2 billion, down 7% year-on-year, and generating Adjusted EBITDA of $8.3 billion, down 4% year-on-year. Net profit attributable to shareholders was $6.7 billion, down 7% year-on-year. Galaxy Macau™’s Adjusted EBITDA was $6.3 billion, down 3% year-on-year. StarWorld Macau’s Adjusted EBITDA was $1.9 billion, down 5% year-on-year. Broadway Macau™’s Adjusted EBITDA was $21 million versus $15 million in 1H 2018.
During 1H 2019, GEG experienced good luck in its gaming operation, which increased its Adjusted EBITDA by approximately $460 million. Normalized 1H 2019 Adjusted EBITDA was down 11% year-on-year to $7.9 billion.
The Group’s total GGR on a management basis 1 in 1H 2019 was $30.6 billion, down 11% year-on-year as total mass table GGR was $14.6 billion, up 8% year-on-year and total VIP GGR was $14.8 billion, down 25% year-on-year. Total electronic GGR was $1.2 billion, up 3% year-on-year.
|
Group Key Financial Data |
|
|
|
(HK$'m) |
1H 2018 |
1H 2019 |
|
Revenues: |
|
|
|
Net Gaming |
23,818 |
22,234 |
|
Non-gaming |
2,572 |
2,653 |
|
Construction Materials |
1,668 |
1,332 |
|
Total Net Revenue |
28,058 |
26,219 |
|
Adjusted EBITDA |
8,645 |
8,315 |
|
|
|
|
|
Gaming Statistics2 |
|
|
|
(HK$'m) |
1H 2018 |
1H 2019 |
|
Rolling Chip Volume3 |
578,111 |
383,234 |
|
Win Rate % |
3.4% |
3.8% |
|
Win |
19,612 |
14,754 |
|
|
|
|
|
Mass Table Drop4 |
58,163 |
60,854 |
|
Win Rate % |
23.3% |
24.0% |
|
Win |
13,551 |
14,611 |
|
|
|
|
|
Electronic Gaming Volume |
36,068 |
32,825 |
|
Win Rate % |
3.3% |
3.7% |
|
Win |
1,174 |
1,213 |
|
|
|
|
|
Total GGR Win5 |
34,337 |
30,578 |
Q2 2019
The Group’s Net Revenue decreased 5% year-on-year and increased 1% quarter-on-quarter to $13.2 billion. Adjusted EBITDA was flat year-on-year and up 9% quarter-on-quarter to $4.3 billion. Galaxy Macau™’s Adjusted EBITDA was flat year-on-year and up 7% quarter-on-quarter to $3.2 billion. StarWorld Macau’s Adjusted EBITDA decreased 4% year-on-year and decreased 1% quarter-on-quarter to $943 million. Broadway Macau™’s Adjusted EBITDA was $6 million versus $2 million in Q2 2018 and $15 million in Q1 2019.
Latest twelve months Adjusted EBITDA was up 1% year-on-year to $16.5 billion and was flat quarter-on-quarter.
During Q2 2019, GEG experienced good luck in its gaming operations which increased Adjusted EBITDA by approximately $349 million. Normalized Q2 2019 Adjusted EBITDA was down 11% year-on-year and grew 3% quarter-on-quarter to $4.0 billion.
The Group’s total GGR on a management basis6 in Q2 2019 was $15.2 billion, down 11% year-on-year and down 1% quarter-on-quarter. Total mass table GGR was $7.3 billion, up 6% year-on-year and down 1% quarter-on-quarter. Total VIP GGR was $7.3 billion, down 25% year-on-year and down 1% quarter-on-quarter. Total electronic GGR was $607 million, up 6% year-on-year and was flat quarter-on-quarter.
|
|
Group Key Financial Data |
|
|
|
|
|
|||||||||||
|
|
(HK$'m) |
|
|
|
|
|
|||||||||||
|
|
|
Q2 2018 |
Q1 2019 |
Q2 2019 |
1H 2018 |
1H 2019 |
|||||||||||
|
|
Revenues: |
|
|
|
|
|
|||||||||||
|
|
Net Gaming |
11,898 |
11,091 |
11,143 |
23,818 |
22,234 |
|||||||||||
|
|
Non-gaming |
1,270 |
1,338 |
1,315 |
2,572 |
2,653 |
|||||||||||
|
|
Construction Materials |
757 |
616 |
716 |
1,668 |
1,332 |
|||||||||||
|
|
Total Net Revenue |
13,925 |
13,045 |
13,174 |
28,058 |
26,219 |
|||||||||||
|
|
|
|
|
|
|
|
|||||||||||
|
|
Adjusted EBITDA |
4,326 |
3,983 |
4,332 |
8,645 |
8,315 |
|||||||||||
|
|
|
|
|
|
|
|
|||||||||||
|
|
Gaming Statistics7 |
|
|
|
|
|
|
||||||||||
|
|
(HK$'m) |
|
|
|
|
|
|
||||||||||
|
|
|
Q2 2018 |
Q1 2019 |
Q2 2019 |
1H 2018 |
1H 2019 |
|
||||||||||
|
|
Rolling Chip Volume8 |
289,319 |
203,568 |
179,666 |
578,111 |
383,234 |
|
||||||||||
|
|
Win Rate % |
3.4% |
3.6% |
4.1% |
3.4% |
3.8% |
|
||||||||||
|
|
Win |
9,744 |
7,429 |
7,325 |
19,612 |
14,754 |
|
||||||||||
|
|
|
|
|
|
|
|
|
||||||||||
|
|
Mass Table Drop9 |
29,653 |
30,463 |
30,391 |
58,163 |
60,854 |
|
||||||||||
|
|
Win Rate % |
23.1% |
24.1% |
23.9% |
23.3% |
24.0% |
|
||||||||||
|
|
Win |
6,836 |
7,345 |
7,266 |
13,551 |
14,611 |
|
||||||||||
|
|
|
|
|
|
|
|
|
||||||||||
|
|
Electronic Gaming Volume |
18,239 |
16,178 |
16,647 |
36,068 |
32,825 |
|
||||||||||
|
|
Win Rate % |
3.1% |
3.7% |
3.6% |
3.3% |
3.7% |
|
||||||||||
|
|
Win |
572 |
606 |
607 |
1,174 |
1,213 |
|
||||||||||
|
|
|
|
|
|
|
|
|
||||||||||
|
|
Total GGR Win10 |
17,152 |
15,380 |
15,198 |
34,337 |
30,578 |
|
||||||||||
|
|
|
|
|
|
|
|
|
|
|
|
|
|
|
|
|
|
|
Balance Sheet and Special Dividends
The Group’s balance sheet remains liquid and healthy. Our solid balance sheet combined with substantial cash flow from operations allows us to return capital to shareholders via dividends, fund our development pipeline and pursue our international expansion ambitions.
As of 30 June 2019, cash and liquid investments were $50.4 billion and net cash was $43.9 billion. Total debt was $6.5 billion as at 30 June 2019, this was due primarily to an ongoing treasury management exercise where interest income on cash holdings exceeds corresponding borrowing costs.
On 26 April 2019, GEG paid a special dividend of $0.45 per share. Subsequently the Group announced another special dividend of $0.46 per share to be paid on or about 25 October 2019.
Galaxy Macau™
Galaxy Macau™ is the primary contributor to the Group’s revenue and earnings. Net Revenue in 1H 2019 was $18.8 billion, down 5% year-on-year. Adjusted EBITDA was $6.3 billion, down 3% year-on-year. Adjusted EBITDA margin under HKFRS was 33% (1H 2018: 33%).
Galaxy Macau™ experienced good luck in its gaming operations which increased its Adjusted EBITDA by approximately $292 million in 1H 2019. Normalized 1H 2019 Adjusted EBITDA was down 12% year-on-year to $6.0 billion.
Q2 2019 Adjusted EBITDA was $3.2 billion, flat year-on-year and up 7% quarter-on-quarter. Adjusted EBITDA margin for Q2 2019 calculated under HKFRS was 34% (Q2 2018: 32%).
Galaxy Macau™ experienced good luck in its gaming operations which increased its Adjusted EBITDA by approximately $253 million in Q2 2019. Normalized Q2 2019 Adjusted EBITDA was down 11% year-on-year and was flat quarter-on-quarter to $3.0 billion.
The combined five hotels registered strong occupancy of virtually 100% in both 1H and Q2 2019.
|
Galaxy Macau™ Key Financial Data |
|||||
|
(HK$'m) |
|
|
|||
|
Q2 2018 |
Q1 2019 |
Q2 2019 |
1H 2018 |
1H 2019 |
|
|
Revenues: |
|
|
|
|
|
|
Net Gaming |
8,869 |
8,130 |
8,405 |
17,601 |
16,535 |
|
Hotel / F&B / Others |
820 |
829 |
832 |
1,639 |
1,661 |
|
Mall |
260 |
305 |
289 |
553 |
594 |
|
Total Net Revenue |
9,949 |
9,264 |
9,526 |
19,793 |
18,790 |
|
|
|
|
|
|
|
|
Adjusted EBITDA |
3,219 |
3,023 |
3,235 |
6,481 |
6,258 |
|
Adjusted EBITDA Margin |
32% |
33% |
34% |
33% |
33% |
|
|
|
|
|
|
|
|
Gaming Statistics11 |
|
|
|
|
|
|
(HK$'m) |
|
|
|
|
|
|
Q2 2018 |
Q1 2019 |
Q2 2019 |
1H 2018 |
1H 2019 |
|
|
Rolling Chip Volume12 |
208,506 |
135,344 |
125,051 |
413,444 |
260,395 |
|
Win Rate % |
3.5% |
3.9% |
4.4% |
3.5% |
4.1% |
|
Win |
7,304 |
5,253 |
5,501 |
14,457 |
10,754 |
|
|
|
|
|
|
|
|
Mass Table Drop13 |
17,289 |
17,906 |
18,118 |
34,043 |
36,024 |
|
Win Rate % |
26.7% |
28.3% |
27.6% |
26.8% |
27.9% |
|
Win |
4,610 |
5,068 |
4,993 |
9,134 |
10,061 |
|
|
|
|
|
|
|
|
Electronic Gaming Volume |
13,311 |
11,106 |
11,235 |
26,901 |
22,341 |
|
Win Rate % |
3.6% |
4.5% |
4.6% |
3.7% |
4.5% |
|
Win |
473 |
502 |
512 |
982 |
1,014 |
|
|
|
|
|
|
|
|
Total GGR Win |
12,387 |
10,823 |
11,006 |
24,573 |
21,829 |
StarWorld Macau
StarWorld Macau’s Net Revenue was down 8% year-on-year to $5.7 billion in 1H 2019. Adjusted EBITDA was down 5% year-on-year to $1.9 billion. Adjusted EBITDA margin under HKFRS was 33% (1H 2018: 32%).
StarWorld Macau experienced good luck in its gaming operations which increased its Adjusted EBITDA by approximately $160 million in 1H 2019. Normalized 1H 2019 Adjusted EBITDA was down 10% year-on-year to $1.7 billion.
Q2 2019 Adjusted EBITDA was $943 million, down 4% year-on-year and down 1% quarter-on-quarter. Adjusted EBITDA margin for Q2 2019 calculated under HKFRS was 34% (Q2 2018: 32%).
StarWorld Macau experienced good luck in its gaming operations which increased its Adjusted EBITDA by approximately $92 million in Q2 2019. Normalized Q2 2019 Adjusted EBITDA was down 14% year-on-year and down 3% quarter-on-quarter to $851 million.
Hotel occupancy was virtually 100% for both the 1H 2019 and Q2.
|
StarWorld Macau Key Financial Data |
|||||
|
(HK$’m) |
Q2 2018 |
Q1 2019 |
Q2 2019 |
1H 2018 |
1H 2019 |
|
Revenues: |
|
|
|||
|
Net Gaming |
2,938 |
2,858 |
2,633 |
6,026 |
5,491 |
|
Hotel / F&B / Others |
109 |
115 |
110 |
218 |
225 |
|
Mall |
13 |
14 |
13 |
26 |
27 |
|
Total Net Revenue |
3,060 |
2,987 |
2,756 |
6,270 |
5,743 |
|
|
|
|
|
|
|
|
Adjusted EBITDA |
987 |
949 |
943 |
1,990 |
1,892 |
|
Adjusted EBITDA Margin |
32% |
32% |
34% |
32% |
33% |
|
|
|
|
|
|
|
|
Gaming Statistics14 |
|
|
|
|
|
|
(HK$'m) |
|
|
|
|
|
|
Q2 2018 |
Q1 2019 |
Q2 2019 |
1H 2018 |
1H 2019 |
|
|
Rolling Chip Volume15 |
79,703 |
67,580 |
53,905 |
161,996 |
121,485 |
|
Win Rate % |
3.0% |
3.2% |
3.3% |
3.1% |
3.3% |
|
Win |
2,407 |
2,165 |
1,789 |
5,077 |
3,954 |
|
|
|
|
|
|
|
|
Mass Table Drop16 |
9,146 |
9,265 |
8,877 |
17,693 |
18,142 |
|
Win Rate % |
18.6% |
18.9% |
19.5% |
19.3% |
19.2% |
|
Win |
1,704 |
1,749 |
1,730 |
3,413 |
3,479 |
|
|
|
|
|
|
|
|
Electronic Gaming Volume |
1,920 |
2,018 |
1,967 |
3,630 |
3,985 |
|
Win Rate % |
2.4% |
2.3% |
2.0% |
2.5% |
2.2% |
|
Win |
46 |
46 |
40 |
89 |
86 |
|
|
|
|
|
|
|
|
Total GGR Win |
4,157 |
3,960 |
3,559 |
8,579 |
7,519 |
Broadway Macau™
Broadway Macau™ is a unique family friendly, street entertainment and food resort supported by Macau SMEs, it does not have a VIP gaming component. The property’s Net Revenue was $298 million for 1H 2019 versus $273 million for 1H 2018. Adjusted EBITDA was $21 million for 1H 2019 versus $15 million in 1H 2018.
Broadway Macau™ experienced good luck in its gaming operations which increased its Adjusted EBITDA by approximately $8 million in 1H 2019. Normalized 1H 2019 Adjusted EBITDA was $13 million versus $14 million in 1H 2018.
Q2 2019 Adjusted EBITDA was $6 million versus $2 million in Q2 2018 and $15 million in Q1 2019.
Broadway Macau™ experienced good luck in its gaming operations which increased its Adjusted EBITDA by approximately $4 million in Q2 2019. Normalized Q2 2019 Adjusted EBITDA was $2 million versus $4 million in Q2 2018 and $11 million in Q1 2019.
Hotel occupancy was virtually 100% for both the 1H 2019 and Q2.
|
Broadway Macau™ Key Financial Data |
|||||
|
(HK$'m) |
|
|
|||
|
|
Q2 2018 |
Q1 2019 |
Q2 2019 |
1H 2018 |
1H 2019 |
|
Revenues: |
|
|
|||
|
Net Gaming |
63 |
76 |
76 |
138 |
152 |
|
Hotel / F&B / Others |
58 |
64 |
59 |
114 |
123 |
|
Mall |
10 |
11 |
12 |
21 |
23 |
|
Total Net Revenue |
131 |
151 |
147 |
273 |
298 |
|
|
|
|
|
|
|
|
Adjusted EBITDA |
2 |
15 |
6 |
15 |
21 |
|
Adjusted EBITDA Margin |
2% |
10% |
4% |
5% |
7% |
|
|
|
|
|
|
|
|
Gaming Statistics17 |
|
|
|||
|
(HK$'m) |
|
|
|||
|
Q2 2018 |
Q1 2019 |
Q2 2019 |
1H 2018 |
1H 2019 |
|
|
Mass Table Drop18 |
322 |
342 |
343 |
690 |
685 |
|
Win Rate % |
18.1% |
20.3% |
21.3% |
19.1% |
20.9% |
|
Win |
59 |
70 |
73 |
132 |
143 |
|
|
|
|
|
|
|
|
Electronic Gaming Volume |
516 |
554 |
444 |
925 |
998 |
|
Win Rate % |
2.4% |
2.7% |
2.4% |
2.4% |
2.6% |
|
Win |
12 |
15 |
11 |
22 |
26 |
|
|
|
|
|
|
|
|
Total GGR Win |
71 |
85 |
84 |
154 |
169 |
City Clubs
City Clubs contributed $56 million of Adjusted EBITDA to the Group’s earnings for 1H 2019, up 4% year-on-year. Q2 2019 Adjusted EBITDA was $29 million, up 4% year-on-year and up 7% quarter-on-quarter.
|
City Clubs Key Financial Data |
|||||
|
(HK$'m) |
|
|
|||
|
|
Q2 2018 |
Q1 2019 |
Q2 2019 |
1H 2018 |
1H 2019 |
|
Adjusted EBITDA |
28 |
27 |
29 |
54 |
56 |
|
|
|
|
|
|
|
|
Gaming Statistics19 |
|
|
|
|
|
|
(HK$'m) |
|
|
|
|
|
|
|
Q2 2018 |
Q1 2019 |
Q2 2019 |
1H 2018 |
1H 2019 |
|
Rolling Chip Volume20 |
1,109 |
644 |
710 |
2,671 |
1,354 |
|
Win Rate % |
3.0% |
1.6% |
5.0% |
2.9% |
3.4% |
|
Win |
33 |
11 |
35 |
78 |
46 |
|
|
|
|
|
|
|
|
Mass Table Drop21 |
2,896 |
2,950 |
3,053 |
5,737 |
6,003 |
|
Win Rate % |
16.0% |
15.5% |
15.4% |
15.2% |
15.5% |
|
Win |
463 |
458 |
470 |
872 |
928 |
|
|
|
|
|
|
|
|
Electronic Gaming Volume |
2,493 |
2,500 |
3,001 |
4,612 |
5,501 |
|
Win Rate % |
1.7% |
1.7% |
1.5% |
1.8% |
1.6% |
|
Win |
41 |
43 |
44 |
81 |
87 |
|
|
|
|
|
|
|
|
Total GGR Win |
537 |
512 |
549 |
1,031 |
1,061 |
Construction Materials Division
The Construction Materials Division contributed Adjusted EBITDA of $564 million in 1H 2019, up 5% year-on-year. Q2 2019 Adjusted EBITDA was $364 million, up 16% year-on-year and up 82% quarter-on-quarter.
Development Update
Galaxy Macau™ and StarWorld Macau
To maintain our resorts competitive position, we are proceeding with a $1.5 billion property enhancement program for Galaxy Macau™ and StarWorld Macau. This program not only enhances our resorts attractiveness, but also includes preparation works for the effective future integration and connectivity of Phases 3 & 4.
Cotai – The Next Chapter
GEG is uniquely positioned for long term growth. We continue with development works for Phases 3 & 4, which will include approximately 4,500 hotel rooms, including family and premium high end rooms, 400,000 square feet of MICE space, a 500,000 square feet 16,000-seat multi-purpose arena, F&B, retail and casinos, among others. We look forward to formally announcing our development plans in the future.
Hengqin
We continue to make progress with our concept plan for a lifestyle resort on Hengqin that will complement our high energy resorts in Macau.
International
Our Japan based team continues with our Japan development efforts. We view Japan as a great long term growth opportunity that will complement our Macau operations and our other international expansion ambitions. GEG, together with Monte-Carlo SBM from the Principality of Monaco and our Japanese partners, look forward to bringing our brand of World Class IRs to Japan.
Selected Major Awards in 1H 2019
|
Award |
Presenter |
|
GEG |
|
|
Casino Operator of the Year Australia & Asia |
12th International Gaming Awards |
|
3 Years IR Awards Winning Company Certificate of Excellence |
Hong Kong Investor Relations Association |
|
Galaxy Macau™ |
|
|
Integrated Resort of the Year |
12th International Gaming Awards |
|
Best Integrated Resort Award Best Gaming Floor Award |
G2E Asia Awards 2019 |
|
Asia’s Most Popular Parent-Child Travel Resort City Supreme Award |
The 19th Golden Horse Awards of China |
|
2018 Macau Green Hotel Awards - Gold Award for Hotel Okura Macau |
Environmental Protection Bureau and Macau Government Tourism Office |
|
StarWorld Macau |
|
|
Asia’s Best Catering Service Hotel Supreme Award |
The 19th Golden Horse Awards of China |
|
TOP 10 City-Nova Hotels of China |
The 14th China Hotel Starlight Awards |
|
Broadway Macau™ |
|
|
Environmental Performance Silver Award |
Macau Environmental Bureau |
|
Construction Materials Division |
|
|
Hong Kong Awards for Environmental Excellence |
Hong Kong Environmental Campaign Committee |
|
The 14th Occupational Health Award - Joyful @ Healthy Workplace Best Practices Award - Excellence Award |
Hong Kong Occupational Safety and Health Council |
|
2018/19 Airport Safety Recognition Scheme - Extraordinary Contribution and Efforts on Airport Safety |
Airport Authority Hong Kong |
|
Caring Company Scheme – 15 Years Plus Caring Company Logo |
The Hong Kong Council of Social Service |
Outlook
We remain confident in the medium to longer term outlook for Macau, this is due to a number of factors including the developing potential of the Chinese tourism market, the ongoing build out of infrastructure that will allow easier access to and movement within Macau and the continuing growth of China’s economy. In the longer term, the growth of China’s GDP will result in a growing demand for Macau’s leisure, tourism and travel.
We do acknowledge that in the shorter term that current international trade tensions may impact customer sentiment and spending habits. We also see increasing competition from regional integrated resorts that are actively targeting the Chinese market.
GEG is well positioned to capitalize on the future growth of Macau through our solid and healthy balance sheet that comfortably enables us to pay dividends, fund our development pipeline and pursue our international expansion ambitious.
In the shorter term, we will keep providing the best facilities to meet the market demand. Additionally as we approach the summer high season, Galaxy Macau™ with its unique 75,000-square-meter Grand Resort Deck that includes the 575-meter-long Skytop Adventure Rapids and the 5,000-square-meter Skytop Wave pool, is ideally positioned to capture a larger share of summer visitors.
In the medium to longer term, we have significant development opportunities with Phases 3 and 4, and Hengqin. In Hengqin, our proposed lifestyle resort will complement our high energy resorts in Macau.
We are also actively pursuing the development of an integrated resort in Japan. We believe that we have the management team, capital resources and development projects to deliver long term shareholder value.
About Galaxy Entertainment Group (HKEx stock code: 27)
Galaxy Entertainment Group (“GEG” or the “Group”) is one of the world’s leading resorts, hospitality and gaming companies. It primarily develops and operates a large portfolio of integrated resort, retail, dining, hotel and gaming facilities in Macau. The Group is listed on the Hong Kong Stock Exchange and is a constituent stock of the Hang Seng Index.
GEG is one of the three original concessionaires in Macau with a successful track record of delivering innovative, spectacular and award-winning properties, products and services, underpinned by a “World Class, Asian Heart” service philosophy, that has enabled it to consistently outperform the market in Macau.
GEG operates three flagship destinations in Macau: on Cotai, Galaxy Macau™, one of the world’s largest integrated destination resorts, and the adjoining Broadway Macau™, a unique landmark entertainment and food street destination; and on the Peninsula, StarWorld Macau, an award winning premium property.
The Group has the largest undeveloped landbank of any concessionaire in Macau. When The Next Chapter of its Cotai development is completed, GEG’s resorts footprint on Cotai will double to more than 2 million square meters, making the resorts, entertainment and MICE precinct one of the largest and most diverse integrated destinations in the world. GEG is also planning to develop a world class, lifestyle leisure resort on a 2.7 square kilometer land parcel on Hengqin adjacent to Macau. This resort will complement GEG’s offerings in Macau, and at the same time differentiate it from its peers while supporting Macau in its vision of becoming a World Centre of Tourism and Leisure.
In July 2015, GEG made a strategic investment in Société Anonyme des Bains de Mer et du Cercle des Etrangers à Monaco (“Monte-Carlo SBM”), a world renowned owner and operator of iconic luxury hotels and resorts in the Principality of Monaco. GEG continues to explore a range of international development opportunities with Monte-Carlo SBM including Japan.
GEG is committed to delivering world class unique experiences to its guests and building a sustainable future for the communities in which it operates.
For more information about the Group, please visit www.galaxyentertainment.com
1 The primary difference between statutory gross revenue and management basis gross revenue is the treatment of City Clubs revenue where fee income is reported on a statutory basis and gross gaming revenue is reported on a management basis. At the Group level the gaming statistics include Company owned resorts plus City Clubs.
2 Gaming statistics are presented before deducting commission and incentives.
3 Reflects junket rolling chip volume only.
4 Mass table drop includes the amount of table drop plus cash chips purchased at the cage.
5 Total GGR win includes gaming win from City Clubs.
6 The primary difference between statutory gross revenue and management basis gross revenue is the treatment of City Clubs revenue where fee income is reported on a statutory basis and gross gaming revenue is reported on a management basis. At the group level the gaming statistics include Company owned resorts plus City Clubs.
7 Gaming statistics are presented before deducting commission and incentives.
8 Reflects junket rolling chip volume only.
9 Mass table drop includes the amount of table drop plus cash chips purchased at the cage.
10 Total GGR win includes gaming win from City Clubs.
11 Gaming statistics are presented before deducting commission and incentives.
12 Reflects junket rolling chip volume only.
13 Mass table drop includes the amount of table drop plus cash chips purchased at the cage.
14 Gaming statistics are presented before deducting commission and incentives.
15 Reflects junket rolling chip volume only.
16 Mass table drop includes the amount of table drop plus cash chips purchased at the cage.
17 Gaming statistics are presented before deducting commission and incentives.
18 Mass table drop includes the amount of table drop plus cash chips purchased at the cage.
19 Gaming statistics are presented before deducting commission and incentives.
20 Reflects junket rolling chip volume only.
21 Mass table drop includes the amount of table drop plus cash chips purchased at the cage.